Hate to crash the bear party, but Bitcoin is primed to explode.Bitcoin is following the same growth pattern Apple did as it established its massive uptrend. Many investors are bearish, calling for low targets like $50K or even $30K—but most don’t realize Bitcoin is likely to rally all the way to a new all-time high.
The trend is your friend, and Bitcoin is in
Key facts today
Next report date
—
Report period
—
EPS estimate
—
Revenue estimate
—
7.93 USD
112.01 B USD
416.16 B USD
14.67 B
About Apple Inc
Sector
Industry
CEO
Timothy Donald Cook
Website
Headquarters
Cupertino
Founded
1976
IPO date
Dec 12, 1980
Identifiers
3
ISIN US0378331005
Apple, Inc engages in the design, manufacture, and sale of smartphones, personal computers, tablets, wearables and accessories, and other variety of related services. It operates through the following geographical segments: Americas, Europe, Greater China, Japan, and Rest of Asia Pacific. The Americas segment includes North and South America. The Europe segment consists of European countries, as well as India, the Middle East, and Africa. The Greater China segment comprises of China, Hong Kong, and Taiwan. The Rest of Asia Pacific segment includes Australia and Asian countries. Its products and services include iPhone, Mac, iPad, AirPods, Apple TV, Apple Watch, Beats products, Apple Care, iCloud, digital content stores, streaming, and licensing services. The company was founded by Steven Paul Jobs, Ronald Gerald Wayne, and Stephen G. Wozniak in 1976 and is headquartered in Cupertino, CA.
Related stocks

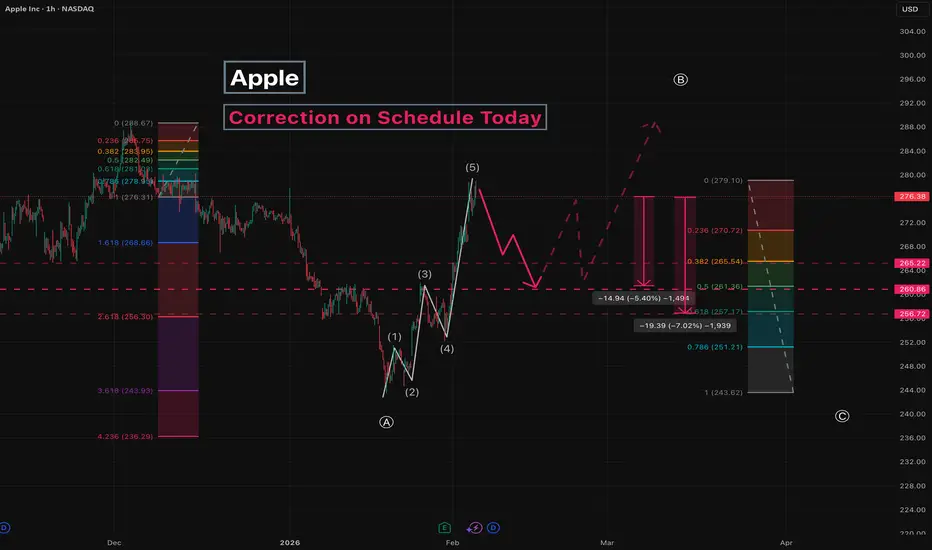
Apple - Correction on Schedule TodayWe continue to cover corrective moves in Apple stock.
Previously, we discussed Wave A .
Currently, the stock price is in Wave B .
The five -wave impulsive move up is complete and is now being corrected.
Key targets:
265 - local correction
260
256
Potential move from current level:
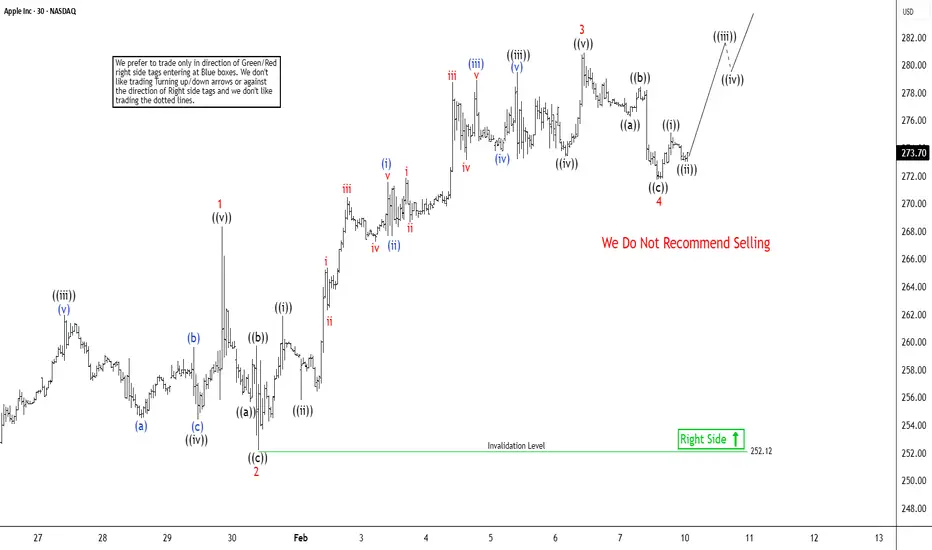
Apple (AAPL) Set to Complete Impulsive Rally from Jan 21 LowThe cycle from the January 21, 2026 low in Apple (AAPL) is unfolding as a five‑wave Elliott Wave impulse. From that low, wave 1 advanced to $268.34, followed by a corrective pullback in wave 2 that terminated at $252.12. The stock then resumed its upward trajectory in wave 3. Within this third wave,
Quick Short Idea $AAPLAAPL looks weak after the quick morning move. It can go back to the opening price if it rejects the 280.00.
Trade Plan:
Short Entry - 280.00
Final Target - 277.00
Stop Loss - 281.00

AAPL (Apple) Stock Update, Price DecreaseAs of today Apple stock market traded between a low of $267.33 and high of $271.88. shares are currently priced at $269.48, with the stock down to 2%. well thanks to the success of the iPhone 17 series, Apple has seen "unprecedent demand," according to CEO Tim Cook. however strong demand could be ch

APPLE: Market of Sellers
Balance of buyers and sellers on the APPLE pair, that is best felt when all the timeframes are analyzed properly is shifting in favor of the sellers, therefore is it only natural that we go short on the pair.
Disclosure: I am part of Trade Nation's Influencer program and receive a monthly fee for

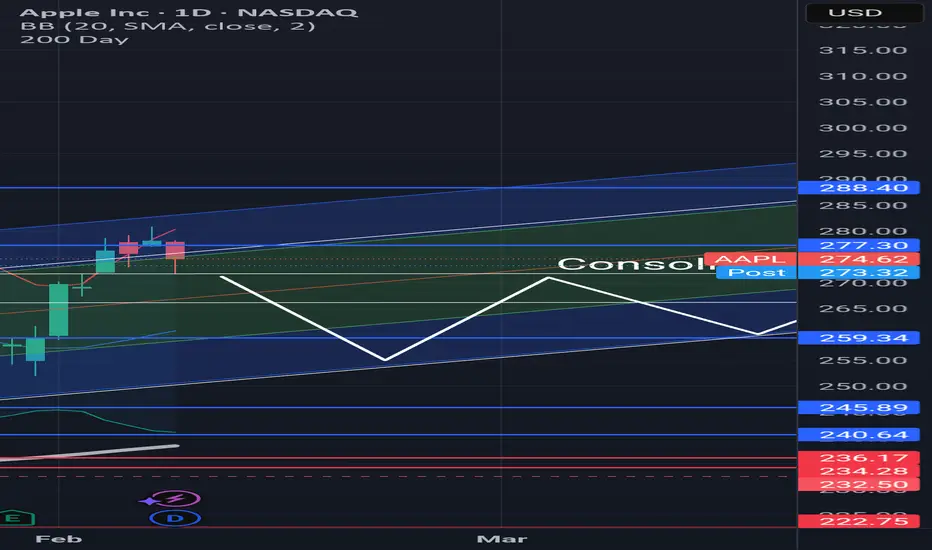
Still in Consolidation, still BullishThis is still going through consolidation, it went up higher than expected. But its not unusual, still bullish.
AAPL CCI system weekly readcompliment to the daily read posted prior. Has similar context. Weekly likes a long side in the 260s with a slightly lower initial target in the 330s

AAPL CCI system read: daily scaleBulls keep winning in the CCI system challenges. I am focusing on the upper 260s-low 270s area for entry. Target into mid-upper 300s currently.
Will play it with out of money calls due to the structure I need to maintain to stay inside my trading discipline. I use a 5% stop but the stop area

RSI Divergence – Momentum Weakening Framework📉 RSI Divergence – Momentum Weakening Framework
This chart illustrates how RSI divergence helps identify weakening momentum during a down move, even when price continues to fall.
RSI divergence is not a buy or sell signal by itself. Instead, it highlights a loss of momentum, often appearing before

See all ideas
Summarizing what the indicators are suggesting.
Neutral
SellBuy
Strong sellStrong buy
Strong sellSellNeutralBuyStrong buy
Neutral
SellBuy
Strong sellStrong buy
Strong sellSellNeutralBuyStrong buy
Neutral
SellBuy
Strong sellStrong buy
Strong sellSellNeutralBuyStrong buy
An aggregate view of professional's ratings.
Neutral
SellBuy
Strong sellStrong buy
Strong sellSellNeutralBuyStrong buy
Neutral
SellBuy
Strong sellStrong buy
Strong sellSellNeutralBuyStrong buy
Neutral
SellBuy
Strong sellStrong buy
Strong sellSellNeutralBuyStrong buy
Displays a symbol's price movements over previous years to identify recurring trends.
US37833EG1
Apple Inc. 2.8% 08-FEB-2061Yield to maturity
5.47%
Maturity date
Feb 8, 2061
US37833ER7
Apple Inc. 4.1% 08-AUG-2062Yield to maturity
5.47%
Maturity date
Aug 8, 2062
APCL
Apple Inc. 3.6% 31-JUL-2042Yield to maturity
5.45%
Maturity date
Jul 31, 2042
US37833EL0
Apple Inc. 2.85% 05-AUG-2061Yield to maturity
5.45%
Maturity date
Aug 5, 2061
US37833DW7
Apple Inc. 2.65% 11-MAY-2050Yield to maturity
5.45%
Maturity date
May 11, 2050
US37833EK2
Apple Inc. 2.7% 05-AUG-2051Yield to maturity
5.44%
Maturity date
Aug 5, 2051
US37833EA4
Apple Inc. 2.55% 20-AUG-2060Yield to maturity
5.43%
Maturity date
Aug 20, 2060
US37833EF3
Apple Inc. 2.65% 08-FEB-2051Yield to maturity
5.43%
Maturity date
Feb 8, 2051
US37833DQ0
Apple Inc. 2.95% 11-SEP-2049Yield to maturity
5.43%
Maturity date
Sep 11, 2049
US37833DZ0
Apple Inc. 2.4% 20-AUG-2050Yield to maturity
5.42%
Maturity date
Aug 20, 2050
US37833EQ9
Apple Inc. 3.95% 08-AUG-2052Yield to maturity
5.40%
Maturity date
Aug 8, 2052
See all AAPL bonds
Frequently Asked Questions
The current price of AAPL is 273.68 USD — it has decreased by −0.24% in the past 24 hours. Watch Apple Inc stock price performance more closely on the chart.
Depending on the exchange, the stock ticker may vary. For instance, on NASDAQ exchange Apple Inc stocks are traded under the ticker AAPL.
AAPL stock has risen by 1.77% compared to the previous week, the month change is a 5.75% rise, over the last year Apple Inc has showed a 19.21% increase.
We've gathered analysts' opinions on Apple Inc future price: according to them, AAPL price has a max estimate of 350.00 USD and a min estimate of 205.00 USD. Watch AAPL chart and read a more detailed Apple Inc stock forecast: see what analysts think of Apple Inc and suggest that you do with its stocks.
AAPL reached its all-time high on Dec 3, 2025 with the price of 288.62 USD, and its all-time low was 0.05 USD and was reached on Jul 8, 1982. View more price dynamics on AAPL chart.
See other stocks reaching their highest and lowest prices.
See other stocks reaching their highest and lowest prices.
AAPL stock is 0.89% volatile and has beta coefficient of 1.32. Track Apple Inc stock price on the chart and check out the list of the most volatile stocks — is Apple Inc there?
Today Apple Inc has the market capitalization of 4.03 T, it has increased by 4.25% over the last week.
Yes, you can track Apple Inc financials in yearly and quarterly reports right on TradingView.
Apple Inc is going to release the next earnings report on Apr 30, 2026. Keep track of upcoming events with our Earnings Calendar.
AAPL earnings for the last quarter are 2.84 USD per share, whereas the estimation was 2.67 USD resulting in a 6.23% surprise. The estimated earnings for the next quarter are 1.93 USD per share. See more details about Apple Inc earnings.
Apple Inc revenue for the last quarter amounts to 143.76 B USD, despite the estimated figure of 138.39 B USD. In the next quarter, revenue is expected to reach 108.60 B USD.
AAPL net income for the last quarter is 42.10 B USD, while the quarter before that showed 27.47 B USD of net income which accounts for 53.27% change. Track more Apple Inc financial stats to get the full picture.
Yes, AAPL dividends are paid quarterly. The last dividend per share was 0.26 USD. As of today, Dividend Yield (TTM)% is 0.38%. Tracking Apple Inc dividends might help you take more informed decisions.
Apple Inc dividend yield was 0.40% in 2025, and payout ratio reached 13.66%. The year before the numbers were 0.43% and 16.11% correspondingly. See high-dividend stocks and find more opportunities for your portfolio.
As of Feb 11, 2026, the company has 166 K employees. See our rating of the largest employees — is Apple Inc on this list?
EBITDA measures a company's operating performance, its growth signifies an improvement in the efficiency of a company. Apple Inc EBITDA is 152.90 B USD, and current EBITDA margin is 34.78%. See more stats in Apple Inc financial statements.
Like other stocks, AAPL shares are traded on stock exchanges, e.g. Nasdaq, Nyse, Euronext, and the easiest way to buy them is through an online stock broker. To do this, you need to open an account and follow a broker's procedures, then start trading. You can trade Apple Inc stock right from TradingView charts — choose your broker and connect to your account.
Investing in stocks requires a comprehensive research: you should carefully study all the available data, e.g. company's financials, related news, and its technical analysis. So Apple Inc technincal analysis shows the buy rating today, and its 1 week rating is buy. Since market conditions are prone to changes, it's worth looking a bit further into the future — according to the 1 month rating Apple Inc stock shows the buy signal. See more of Apple Inc technicals for a more comprehensive analysis.
If you're still not sure, try looking for inspiration in our curated watchlists.
If you're still not sure, try looking for inspiration in our curated watchlists.