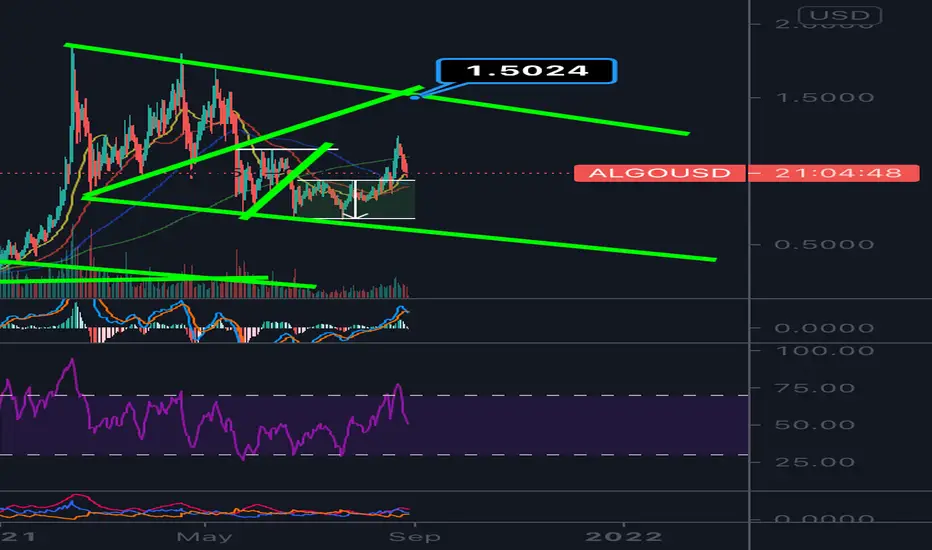
2.55 Price target for ALGORAND 2.55 Price target for ALGORAND Cup & Handle Breakout 2.55 Price target for ALGORAND Cup & Handle Breakout
ALGUSD trade ideas

Algo explosion by end of OctoberThe last time the weekly RSI was at these levels there was a massive move upward (486%) in the following 4-5 weeks. If we see the same result as last time, algo could move as high as $5.90 (unrealistic in my opinion) or at least $2.50s. With goverance happening in October, I don't see a scenario where algo doesn't move up, and quick.

Algo bullish setup potential Looks like we have came back and looking to retest previous sideways trading range around this .95 cent range. We back test and hold, this will be extremely bullish. We fall and close below back in channel, further consildation will be needed. Bouncing here could
Be spring board for 1.43$ target


ALGO - personal buy near 2020 HighAlgorand (ALGO) is in a technical downtrend, which appears to be weakening (see MACD and thinning negative Ichimoku cloud). For a conservative trade, waiting for the MAs to cross would support a trend reversal. Personal trade made at @0.85111. Please follow BradtNom, leave a comment or link to your own ideas! Charts are for information purposes only. Not trade suggestions. DYOR (Do your own research) - act responsibly with your money.

Local Bottoms and Local TopsWithout fail, Algorand has stuck to this pattern for over 7 months now. Roughly every 30 days is a local bottom. The most recent doesn't seem like a bottom because on the chart it is in the same range algo had been bound to for quite awhile.
My target for the next local top, meaning within the next 18-25 days, is in yellow.


#Algo to the Moon!Hello, my dear padawans,
This is my first review, chart analysis on ALGOUSD.
I always love to draw chart patterns, to discover something we can explore to my padawans.
Do not take this as a piece of financial advice.
Let's see what's gonna happen next.
may the force be with you.
Cheers.


Algorand (ALGO) - august 10Hello?
Welcome, traders.
By "following", you can always get new information quickly.
Please also click "Like".
Have a nice day.
-------------------------------------
(ALGOUSD 1W Chart)
If the price is maintained above the 0.5221395-0.76754798 range, it is expected to create a new wave.
(1D chart)
If the price is maintained in the 0.65798713-0.92350974 range, it is expected to turn into an uptrend.
However, in order to continue the uptrend, it must break out of the downtrend line.
If it goes down, you should check to see if it finds support at the 0.52522584-0.65798713 zone.
-------------------------------------
(ALGOBTC 1W chart)
We are walking sideways in the section 1075 Satoshi-6469 Satoshi.
If the price is maintained above the 1970 satoshi-2886 satoshi range, it is expected to turn into an upward trend.
To continue the uptrend, it must rise above the 4309 Satoshi point.
If it rises above the 6469 Satoshi point, it is expected to create a new wave.
(1D chart)
If it finds support at the 1820 satoshi point and moves above the 2147 satoshi point, I would expect it to turn into an uptrend.
If the volume profile section spanning the 2452 Satoshi-2886 Satoshi section is exceeded upward, it is expected to continue the upward trend.
If it falls from the 1820 Satoshi point, it may enter the mid- to long-term investment area, so careful trading is required.
------------------------------------------
We recommend that you trade with your average unit price.
This is because, if the price is below your average unit price, whether it is in an uptrend or in a downtrend, there is a high possibility that you will not be able to get a big profit due to the psychological burden.
The center of all trading starts with the average unit price at which you start trading.
If you ignore this, you may be trading in the wrong direction.
Therefore, it is important to find a way to lower the average unit price and adjust the proportion of the investment, ultimately allowing the funds corresponding to the profits to regenerate themselves.
------------------------------------------------------------ -----------------------------------------------------
** All indicators are lagging indicators.
Therefore, it is important to be aware that the indicator moves accordingly with the movement of price and volume.
However, for the sake of convenience, we are talking in reverse for the interpretation of the indicator.
** The wRSI_SR indicator is an indicator created by adding settings and options to the existing Stochastic RSI indicator.
Therefore, the interpretation is the same as the traditional Stochastic RSI indicator. (K, D line -> R, S line)
** The OBV indicator was re-created by applying a formula to the DepthHouse Trading indicator, an indicator disclosed by oh92. (Thanks for this.)
** See support, resistance, and abbreviation points.
** Support or resistance is based on the closing price of the 1D chart.
** All descriptions are for reference only and do not guarantee a profit or loss in investment.
Explanation of abbreviations displayed in the chart
R: A point or section of resistance that requires a response to preserve profits.
S-L: Stop Loss point or section
S: A point or section where you can buy to make a profit as a support point or section.
(Short-term Stop Loss can be said to be a point where profit and loss can be preserved or additional entry can be made through split trading. It is a short-term investment perspective.)
GAP refers to the difference in prices that occurred when the stock market, CME, and BAKKT exchanges were closed because they are not traded 24 hours a day.
G1 : Closing price when closed
G2: Opening price
(Example) Gap (G1-G2)

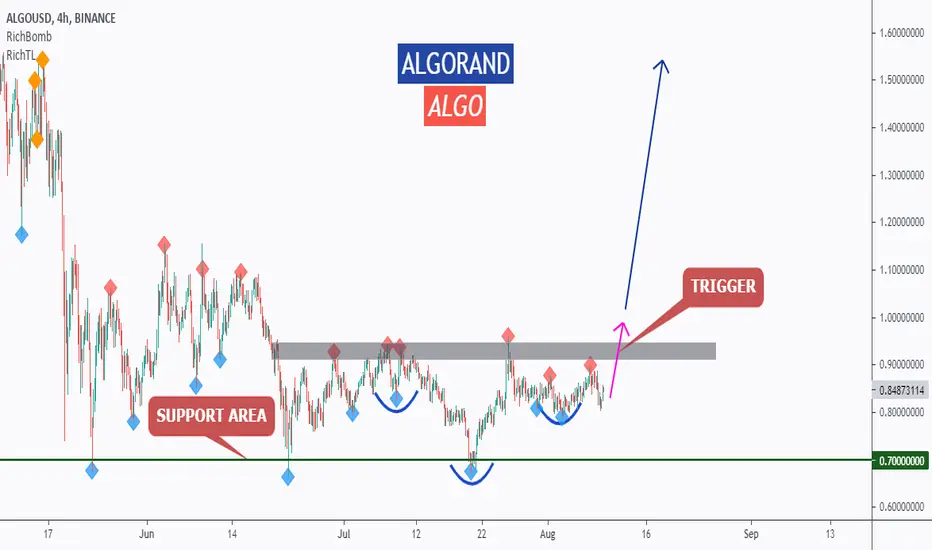
ALGO - Wait For The Trigger!Hello everyone, if you like the idea, do not forget to support with a like and follow.
ALGO is sitting around strong support in green so we will be looking for buy setups.
on H4: ALGO formed an inverse head and shoulders pattern but it is not ready to go yet.
Before we buy, we want the buyers to prove that they are taking over again.
You don't want to buy a bearish market right?
Trigger => Waiting for a momentum candle close above the gray neckline to buy.
Meanwhile, until the buy is activated, ALGO would be overall bearish can still trade lower.
Good luck!
All Strategies Are Good; If Managed Properly!
~Rich