ALPHAUSDT.P trade ideas

#ALPHA: Will the Bulls Take Over or Is Another Shakeout Coming?Yello, Paradisers! Is #ALPHAUSDT ready for a major breakout, or will weak hands get liquidated before the real move begins? Let’s dive into the latest setup of #Stella:
💎#ALPHA is trading within a falling wedge, a classic bullish reversal pattern. This setup often signals a strong breakout once the price breaks above the descending resistance. The probability of a bullish breakout is high due to the bullish divergence on the MACD.
💎The immediate resistance is at $0.0659. A decisive break and close above this level could trigger a bullish rally toward the next target at $0.0934. But the real game-changer will be the strong resistance zone around $0.12. If ALPHA pushes through that, you can expect fireworks.
💎The bullish divergence on the MACD further strengthens the bullish outlook. This indicates potential momentum building up for a reversal. However, don't rule out a possible liquidity grab—we might see the price dip towards the $0.0368 or even the $0.0245 strong support zone to shake out weak hands before the real move happens.
💎The $0.0368 support level is crucial. A breakdown below this could lead to a retest of the $0.0245 zone. If #ALPHAUSD falls below $0.0245, the bullish setup would be invalidated, and we might see a deeper correction towards $0.01. Stay vigilant and manage your risk carefully.
Stay focused, patient, and disciplined, Paradisers🥂
MyCryptoParadise
iFeel the success🌴

ALPHAUSDT 1WALPHA ~ 1W Analysis
#ALPHA If you still have a Conviction on this Coin, Maybe you can consider this support to start buying again, a minimum target of 20%+
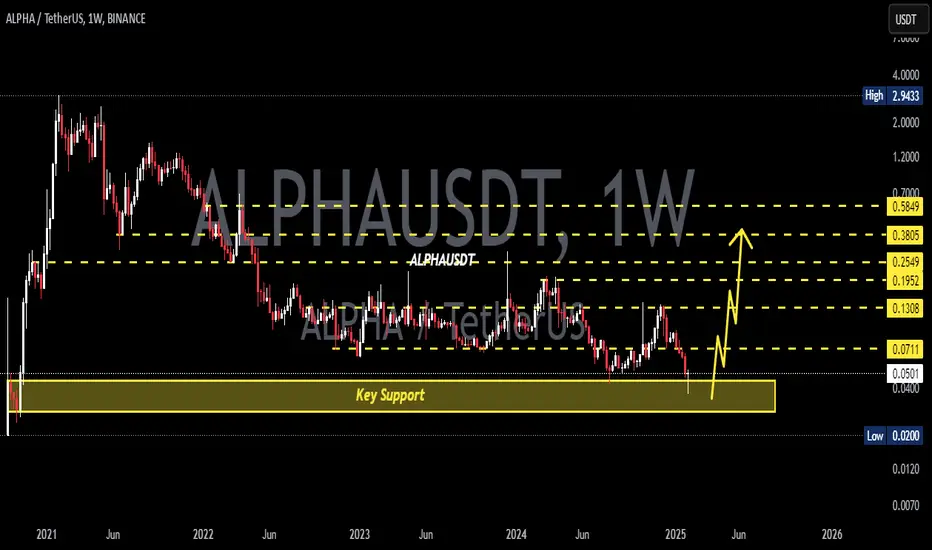

ALPHA/USDTKey Level Zone: 0.07800 - 0.07850
HMT v4.1 detected. The setup looks promising, supported by a previous upward/downward trend with increasing volume and momentum, presenting an excellent reward-to-risk opportunity.
HMT (High Momentum Trending):
HMT is based on trend, momentum, volume, and market structure across multiple timeframes. It highlights setups with strong potential for upward movement and higher rewards.
Whenever I spot a signal for my own trading, I’ll share it. Please note that conducting a comprehensive analysis on a single timeframe chart can be quite challenging and sometimes confusing. I appreciate your understanding of the effort involved.
Important Note :
Role of Key Levels:
- These zones are critical for analyzing price trends. If the key level zone holds, the price may continue trending in the expected direction. However, momentum may increase or decrease based on subsequent patterns.
- Breakouts: If the key level zone breaks, it signals a stop-out. For reversal traders, this presents an opportunity to consider switching direction, as the price often retests these zones, which may act as strong support-turned-resistance (or vice versa).
My Trading Rules
Risk Management
- Maximum risk per trade: 2.5%.
- Leverage: 5x.
Exit Strategy
Profit-Taking:
- Sell at least 70% on the 3rd wave up (LTF Wave 5).
- Typically, sell 50% during a high-volume spike.
- Adjust stop-loss to breakeven once the trade achieves a 1.5:1 reward-to-risk ratio.
- If the market shows signs of losing momentum or divergence, ill will exit at breakeven.
The market is highly dynamic and constantly changing. HMT signals and target profit (TP) levels are based on the current price and movement, but market conditions can shift instantly, so it is crucial to remain adaptable and follow the market's movement.
If you find this signal/analysis meaningful, kindly like and share it.
Thank you for your support~
Sharing this with love!
HMT v2.0:
- Major update to the Momentum indicator
- Reduced false signals from inaccurate momentum detection
- New screener with improved accuracy and fewer signals
HMT v3.0:
- Added liquidity factor to enhance trend continuation
- Improved potential for momentum-based plays
- Increased winning probability by reducing entries during peaks
HMT v3.1:
- Enhanced entry confirmation for improved reward-to-risk ratios
HMT v4.0:
- Incorporated buying and selling pressure in lower timeframes to enhance the probability of trending moves while optimizing entry timing and scaling
HMT v4.1:
- Enhanced take-profit (TP) target by incorporating market structure analysis

LONG entry for Alpha At this moment, it looks like Alpha will turn to the upside and create a great opportunity to make more than 50% profit.

ALPHAMy friends, I mentioned to you the gathering areas, which were from 0.080 to 0.090, and now the price is 0.076.
They are considered good areas.
We will continue to update continuously.

alpha In the first quarter and the first half of 2024, a decline occurred, which led to a decline in the alpha currency.
Now we have a good model for the rise and we have a good opportunity from the 0.080 areas to this price 0.090, which is considered good accumulation areas.
At the very least, we have targets between 0.15 and 0.20

BUY ALPHAUSDT - BULLISH SIGNAL, HIGH REWARD 100%+ GAINOverview:
We are excited to share a high-probability trading signal for BINANCE:ALPHAUSDT ALPHA/USDT , backed by strong technical indicators and market analysis.
Chart Analysis:
The chart for ALPHA/USDT indicates a compelling opportunity with a probability of success estimated at up to 80%. Technical indicators align with a positive trend, providing a solid foundation for potential price appreciation.
Reasons to Consider:
Bullish Momentum: ALPHA/USDT is exhibiting clear signs of bullish momentum, with key indicators pointing towards a sustained upward movement.
Historical Support: Historical price action shows a strong support level at , reinforcing the likelihood of a positive price trend.
Market Sentiment: Current market sentiment supports the potential for a significant price increase, with an estimated 80% probability of success.
Stop-Loss: To manage risk, consider placing a stop-loss at .
Disclaimer:
While the probability of success is estimated at 80%, trading always involves risk. Conduct thorough research and consider market conditions before making any investment decisions. This analysis is based on technical indicators and historical data, and market dynamics may change. Implement proper risk management strategies to safeguard your capital.
Conclusion:
The ALPHA/USDT signal presents a high-probability opportunity for traders, with strong technical support and positive market sentiment. Stay vigilant, monitor price movements, and adapt your strategy as needed. Happy trading!
Adjust the details and levels based on your specific analysis and market conditions. Always keep your trading signals updated as new information becomes available.

ALPHAUSDT 1WALPHA ~ 1W
#ALPHA So far it continues to maintain this support block,. If you still have Conviction on this coin,. buy after retesting this support block, with a short-term target of at least 20%+

ALPHA planThis is my plan for ALPHA. Buy in orange box because I expect us to go down a little bit lower.

Alpha/UsdtBINANCE:ALPHAUSDT
🔹 **Current Price:** $0.0839
🔹 **Resistance Levels (if price holds):**
- 🚀 **$0.0950**
- 🚀 **$0.1034**
- 🚀 **$0.132**
🔹 **Support Levels (if price doesn't hold):**
- 📉 **$0.0750**
- 📉 **$0.0645**
---
### 🚀 If the price stays around **$0.0839** and pushes higher, the next resistance levels are **$0.0950**, **$0.1034**, and potentially up to **$0.132**. If the price tests these levels successfully, it could indicate a strong bullish momentum. 💥
### 📉 If the price falls below **$0.0839**, the support levels to watch are **$0.0750** and **$0.0645**. If the price breaks these levels, there might be further downward movement. ⚠️
---
This is just a technical analysis and is **not financial advice**. Always do your own research (DYOR)! 📊

alpha Alpha minor has broken its downward trend. The TP region of alpha, which has now completed its retest, is 0.1350.

ALPHA Ending Diagonal
▶️Price action for this coin is very choppy, but it seems that it is forming an ending diagonal.
▶️In this scenario, blue C / black 5 would target a new low under 0,0424.
▶️This view is supported by the lack of RSI divergence on black 3 low.

End of wave 4At first, the daily candle of 22 OCT was a noise.
It is completing wave 4, I am waiting for the rotation from the yellow box. The next stop can be 0.20. I will update after correction.

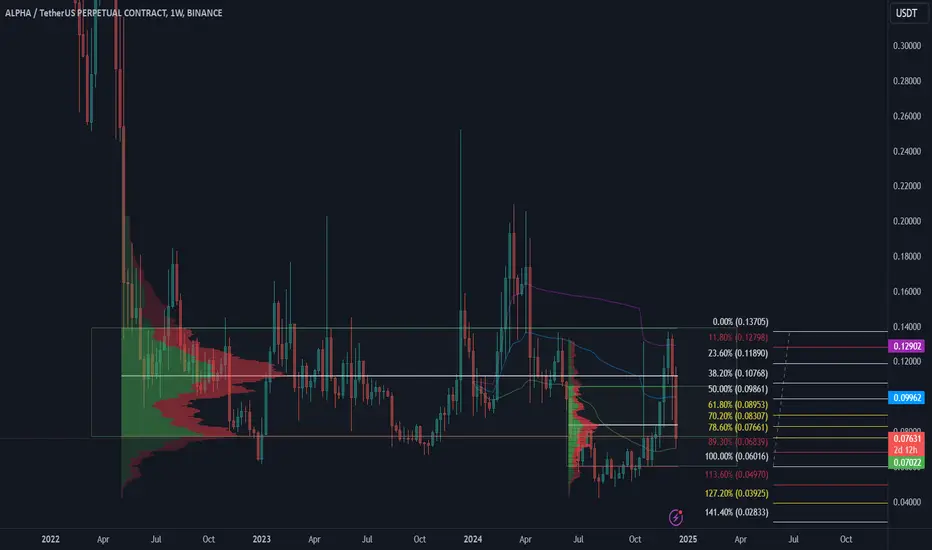
300X NOT SO FAR FOR ALPHA/USDT !!!!!ALPHA/USDT shows signs of a potential trend reversal on the weekly chart. The price, currently at 0.1074, has been in a downtrend since 2021. Key levels to watch are resistance at 0.1327 and support at 0.0754. The CM Ultimate MA MTF indicator gives a "Long" signal at the support level, suggesting a buying opportunity. The MACD histogram displays increasing positive momentum with green bars. The MACD line sits above the signal line, confirming bullish sentiment. A price projection of 0.3188 appears in the top-right corner, hinting at significant upside potential. While the chart suggests a favorable risk-to-reward ratio, the 300x speculation remains highly dependent on volatile market conditions. Traders should monitor key levels and employ proper risk management strategies.

#ALPHA/USDT Ready to go higher
#ALPHA
The price is moving in a descending channel on the 1-hour frame and sticking to it well
We have a bounce from the lower limit of the descending channel, this support is at 0.1048
We have a downtrend on the RSI indicator that is about to be broken, which supports the rise
We have a trend to stabilize above the moving average 100
Entry price 0.1080
First target 0.1110
Second target 0.1182
Third target 0.1248

Alpha/UsdtBINANCE:ALPHAUSDT
---
🚨 ** NSE:ALPHA Bullish Setup Alert** 📈
**Heads up!** We have a potential bullish move in play with key resistance levels around **0.1280 - 0.1300**. Keep an eye on it—don’t sleep on your gains! 🔥
⚠️ **Reminder:** This is not financial advice—just sharing the setup for educational purposes! Always do your own research. ⭐️🐳
---

$Alpha / Usdt Bullish Prediction ===> Possible 4x-8x returnsHello traders,
Another beautiful chart Infront of us. Stella is nearly $100mil UsD market cap coin which considered smaller cap nearing medium cap range. When we zoom out the weekly chart , it is fairly easy to see something big brewing. Weekly Volume increasing gradually, it is pointing out that investor confidence is increasing as it progresses. I am expecting good 4x to 8x return by looking at fib levels and previous infliction points on the chart. First stop should be quicker $0.27-0.3 range then longer term $0.6 then possibly $1 target!
Btc dominance is going down and USDT dominance dropping rapidly which further confirms for major altcoin season. Most largest cap altcoins gained 2-3x already , next will be smaller market cap alt coins. make sure to do your own research! I will update this chart as we move along. This is not short term prediction so it will take some time!

Alpha/usdt approaching a critical breakout zone Alpha/usdt approaching a critical breakout zone
Alpha/usdt is nearing a significant trendline resistance after a prolonged consolidation phase. The price action suggests that momentum is building for a potential breakout. If this happens, it could pave the way for a strong bullish move.
Key observations:
- The trendline has acted as a cap on the price for an extended period, and a break above it could indicate a major shift in market dynamics.
- Volume is gradually increasing, signaling growing interest among traders.
- Momentum indicators like rsi and macd are aligning with the potential breakout, hinting at a bullish bias.
Tips for trading this setup:
- Wait for a clear 4h or daily candle close above the trendline to confirm the breakout.
- Look for a retest of the breakout zone to establish it as a new support level.
- Ensure the breakout is supported by a noticeable increase in trading volume to validate its strength.
Risk management is key. Set a stop-loss below the breakout zone to manage potential invalidation and position yourself wisely. This analysis is for educational purposes; always do your own research and trade responsibly.

ALPHA Will Shows Significant Gains But Finally CollapsesHello, Skyrexians!
As you know we like to share with you analysis on crypto assets which are in uptrend and have significant potential to grow. Today we wanna show you the example of coin which is likely in global downtrend. For sure BINANCE:ALPHAUSDT has not set the lower low in comparison to previous bull run, but it dropped significantly to set the new ATH, that is we expect only exit pump.
Let's take a look at the weekly time frame. We can see that current bear market is much more intensive than on other assets. We can see here the clear 5 Elliott waves structure to the downside. The wave 5 is likely to be finished already finishing the wave 1 of higher degree. Green dot on the Bullish/Bearish Reversal Bar Indicator shows us the strongest reversal sign that bear market is finished.
It means, that large wave 2 can happen now. Despite this asset is in global downtrend it can make significant gains reaching 0.5-0.61 Fibonacci retracement level. Notice that this Fibonacci based on regular chart. We show Fibo chart for your convenience. The target is located between $1.47 and $1.87. After such incredible growth we expect the huge crash to new all-time low.
Best regards,
Skyrexio Team
___________________________________________________________
Please, boost this article and subscribe our page if you like analysis!

ALPHAUSDT 1WALPHA ~ 1W
#ALPHA If you still have Conviction on this coin,. Buy gradually inside this pattern,. it is only a matter of time that this resistance line is successfully broken, with a minimum target of 20%+
