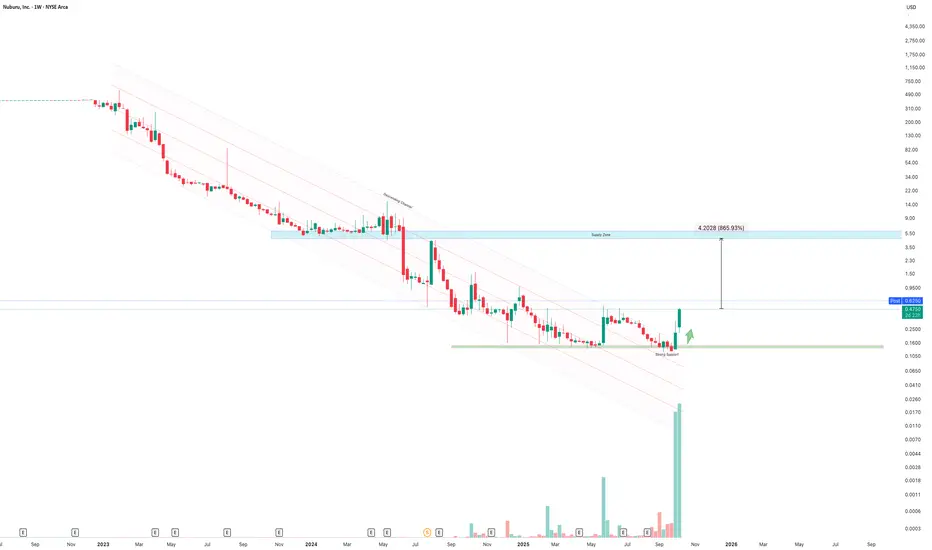
Buru to $5.00 NearTerm?!The chart illustrates a confirmed breakout from a long-term descending channel following an extended period of accumulation near strong support around $0.16–$0.20. A powerful volume surge — the largest in the stock’s history — confirms strong momentum and potential trend reversal.
Price has now clo
−2.1603 USD
−34.52 M USD
152.13 K USD
131.89 M
About Nuburu, Inc.
Sector
Industry
Website
Headquarters
Centennial
Founded
2015
ISIN
US67021W3016
FIGI
BBG00XY98XV5
Nuburu, Inc. operates as a developer and manufacturer of high-power, high-brightness blue lasers for welding and 3D printing industries worldwide. The firm offers Nuburu AO-150 and NUBURU BL. It produces faster, higher quality welds and parts than current lasers can provide in laser welding and additive manufacturing of copper, gold, aluminum, and other industrially essential metals. The company was founded by Mark S. Zediker and Jean-Michel Pelaprat in 2015 and is headquartered in Centennial, CO.
Related stocks
Nuburu analysisI will not be using AI to generate this. Here is my reason for why I believe in BURU despite terrible financials in the previous quarters. First lets begin with what they do: their main product is blue laser used for welding different metals. Blue laser is scientifically proven to be way more effect

bullish to 2.85After a proper correction to the 50 Fibo, the price can move towards 2.85 with a fractal breakout.

bullish 4 hour chart - retrace to $2.86 SP breaking downward trend and above VWMA. TP = $2.86 retrace to $2.04 before big retrace to $6.0 (sp 15.65 fib 6.18).

Nuburu Just entered the Asian market deal with Japanese Lazer Co. 100 million valuation on their patent portfolio.
Less than 20 million float. Acquired bridge loan so they are financed.
Check this company out. Overlooked and way oversold. Based on portfolio and float this is a $5 stock. Shorted down to .1


BURU - Technical Bottom PlayNuburu Inc is a leading innovator in high-power, high-brightness blue laser technology that is focused on bringing breakthrough improvements to multiple markets, including e-mobility, healthcare, and consumer electronics via a broad range of high-value applications that include welding and 3D printi

See all ideas
Summarizing what the indicators are suggesting.
Oscillators
Neutral
SellBuy
Strong sellStrong buy
Strong sellSellNeutralBuyStrong buy
Oscillators
Neutral
SellBuy
Strong sellStrong buy
Strong sellSellNeutralBuyStrong buy
Summary
Neutral
SellBuy
Strong sellStrong buy
Strong sellSellNeutralBuyStrong buy
Summary
Neutral
SellBuy
Strong sellStrong buy
Strong sellSellNeutralBuyStrong buy
Summary
Neutral
SellBuy
Strong sellStrong buy
Strong sellSellNeutralBuyStrong buy
Moving Averages
Neutral
SellBuy
Strong sellStrong buy
Strong sellSellNeutralBuyStrong buy
Moving Averages
Neutral
SellBuy
Strong sellStrong buy
Strong sellSellNeutralBuyStrong buy
Displays a symbol's price movements over previous years to identify recurring trends.
Frequently Asked Questions
The current price of BURU is 0.5013 USD — it has decreased by −29.38% in the past 24 hours. Watch Nuburu, Inc. stock price performance more closely on the chart.
Depending on the exchange, the stock ticker may vary. For instance, on AMEX exchange Nuburu, Inc. stocks are traded under the ticker BURU.
BURU stock has risen by 151.72% compared to the previous week, the month change is a 232.30% rise, over the last year Nuburu, Inc. has showed a −62.02% decrease.
BURU reached its all-time high on Feb 1, 2023 with the price of 560.0000 USD, and its all-time low was 0.1206 USD and was reached on Sep 8, 2025. View more price dynamics on BURU chart.
See other stocks reaching their highest and lowest prices.
See other stocks reaching their highest and lowest prices.
BURU stock is 20.84% volatile and has beta coefficient of 3.30. Track Nuburu, Inc. stock price on the chart and check out the list of the most volatile stocks — is Nuburu, Inc. there?
Today Nuburu, Inc. has the market capitalization of 61.06 M, it has increased by 71.37% over the last week.
Yes, you can track Nuburu, Inc. financials in yearly and quarterly reports right on TradingView.
BURU net income for the last quarter is −12.22 M USD, while the quarter before that showed −16.61 M USD of net income which accounts for 26.41% change. Track more Nuburu, Inc. financial stats to get the full picture.
No, BURU doesn't pay any dividends to its shareholders. But don't worry, we've prepared a list of high-dividend stocks for you.
As of Oct 10, 2025, the company has 8 employees. See our rating of the largest employees — is Nuburu, Inc. on this list?
EBITDA measures a company's operating performance, its growth signifies an improvement in the efficiency of a company. Nuburu, Inc. EBITDA is −14.85 M USD, and current EBITDA margin is −8.13 K%. See more stats in Nuburu, Inc. financial statements.
Like other stocks, BURU shares are traded on stock exchanges, e.g. Nasdaq, Nyse, Euronext, and the easiest way to buy them is through an online stock broker. To do this, you need to open an account and follow a broker's procedures, then start trading. You can trade Nuburu, Inc. stock right from TradingView charts — choose your broker and connect to your account.
Investing in stocks requires a comprehensive research: you should carefully study all the available data, e.g. company's financials, related news, and its technical analysis. So Nuburu, Inc. technincal analysis shows the buy rating today, and its 1 week rating is buy. Since market conditions are prone to changes, it's worth looking a bit further into the future — according to the 1 month rating Nuburu, Inc. stock shows the neutral signal. See more of Nuburu, Inc. technicals for a more comprehensive analysis.
If you're still not sure, try looking for inspiration in our curated watchlists.
If you're still not sure, try looking for inspiration in our curated watchlists.