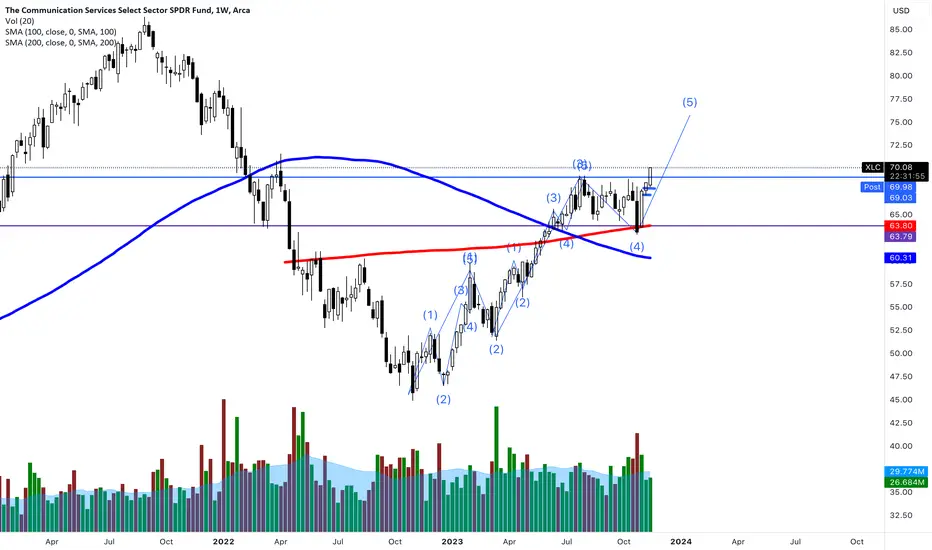
XLC Communications Bull Flag Break OutCommunications ETF broke out of a bull flag this week with a price objective of $110.94. AMEX:XLC
XLC trade ideas

Analyzing Sector Dynamics and Momentum ShiftsIntroduction:
The performance ratio between the communications sector (XLC) and the technology sector (XLK) highlights two of the market's leading sectors, both of which feature overlapping companies. While XLC has been a strong performer for much of the year, it has recently shown signs of weakness, even lagging behind traditionally defensive sectors like utilities. Historically, technology has maintained more consistent strength compared to communications.
Analysis:
Sector Comparison: The XLC-to-XLK ratio helps gauge the relative momentum between these two sectors. Recent weakness in XLC, paired with XLK’s historical stability, suggests a shift in relative strength back toward technology.
Rectangle Pattern: Currently, the XLC-to-XLK ratio displays a rectangle formation, which hints at a potential continuation of the downtrend should the ratio break below the rectangle’s lower trendline. This pattern could indicate that XLC’s outperformance may have peaked for now.
Momentum Shift: Although XLC has shown some recent underperformance, any shift in momentum away from communications is likely to be gradual rather than abrupt, given the current technical setup.
Conclusion:
The relative performance of XLC and XLK is crucial for understanding current sector dynamics and where momentum may be shifting. While technology remains robust, the recent pattern in the XLC-to-XLK ratio suggests a possible weakening in communications. Traders should watch for a break below the rectangle pattern to confirm a continuation of the downtrend. What’s your view on the XLC-to-XLK relationship? Share your thoughts below!
Charts: (Include relevant charts showing the XLC-to-XLK ratio, the rectangle formation, and the potential breakout areas)
Tags: #Communications #Technology #SectorAnalysis #XLC #XLK #TechnicalPatterns

XLC ETF rejection . US ETFDouble top rejection
rising channel breakdown
if highs breakout then trade will be in valid
86/85/84/83 can test soon

XLC PutAMEX:XLC - Buy Jun-07-24 $82.5 Strike Puts @ $0.7 Limit to Open
Prime for a short. Oscillator overbought and diverging downward. Put prices are attractive and not overpriced like major indices. Topping a major resistance ceiling, and price formation, makes it a very attractive short.

$XLC: 82.5 Might Be A GoThe communications sector is seeing incredible strength with NFLX making strong moves on the day. We see this and the broader tech, Nasdaq areas of the market moving higher as well. Good luck traders

XLC Weekly ChartFun Fact in 2018 tech became to large of a percentage of the S&P500 and the committee decide to change the Telecomm sector name to communication services. Alphabet and Facebook now Meta moved from technology along with some key names from the consumer discretionary sector like Disney, Comcast, and Netflix. Fast forward to today we are slowly approaching all time highs. Question is what happens after we get there?

$XLC: A Pop Over 80?This comms sector ETF seems to be showing promise here for at least a short term move off the 80 handle. If Google finds a near term bottom and NFLX gets a bid off 600 we could see XLC probe higher. Good luck traders

$XLC: Back Over 80 Soon?Looking at the comms sector to potentially make a move back above 80 here, we have seen recent underperformance but our assumption here is that we may look back above this level in the near future. Despite GOOGL underperformance, NFLX seems to have no end to it's rally in sight.

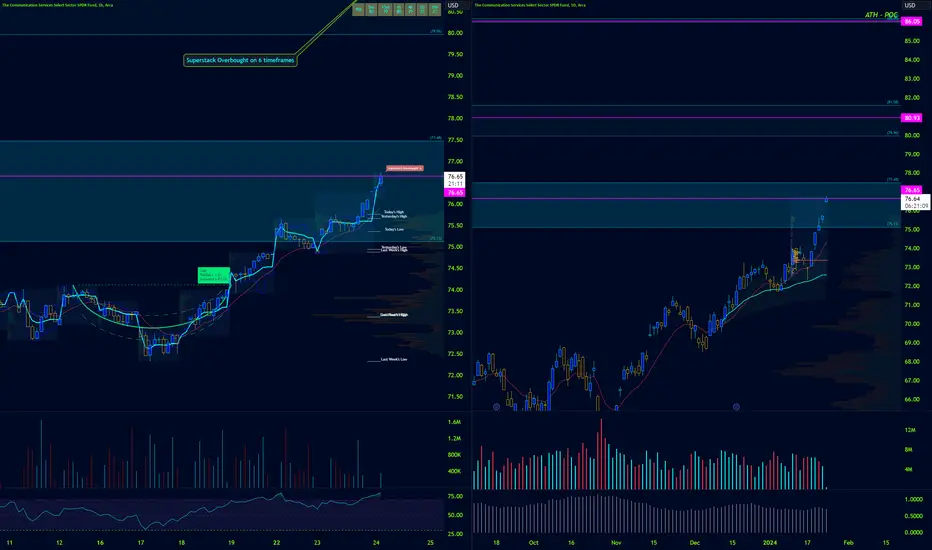
Gaps up into long term ResistanceGaps are for buying and selling right? Well, this gap is right into a 52 week resistance level, with all 6 timeframes decently overbought. Looking short here with first target at 75. This thing moves slowly so i'll revaluate whenever we get there. A move to 77 would not be ideal, allowing for a potential break and bounce of this POC level, giving some potential to longer-term continuation.
The Communications Sector Is Breaking OutCommunications could be on the verge of a strong breakout as price has broken, and stayed above, the $69.50 area.
Many of the top stocks in the sector are running on the back of strong earnings, like Meta, Netflix, and Disney:
META:
NFLX:
DIS:
Buying shares now and risking to $67 could be a great long-term move, while trailing the position on short term swing pivots.
Alternatively, buying $67 strike call options at $400 a pop and aiming to take off half at a 1:1 to pay for the trade could be a solid move. Be careful with these and work your orders, the options aren't the most liquid things in the world.
Either way, we like the setup here and have bought some shares to track how it progresses.
Cheers!
Looking for more high-quality trade ideas? Follow us below. ⬇️⬇️

$XLC - key levels. Corrective activity, gap fills required...before a sustainable move into the green 50% rule box. Then proceed to the targets. Ideal scenario, if it traps both the FOMO players AND the bears. #TheStrat

$XLC, the strongest US sector in bearish territoryI am watching 50% Fibonacci retracement line from the peak to Oct 2022 bottom.

XLC sectorXLC is approaching a trigger to the downside that hasn't been seen since 10/20/23. Puts are possible for the tickers in this sector on the Weeklies.

XLC Strong Sector / Ready for Flat Base Breakout?The Communications Sector has been doing well in this choppy market. This Weekly Chart shows AMEX:XLC forming a flat base. And compared to other sectors it is showing good Relative Strength.
I have set an alert on the resistance line. If the market starts firming up and this triggers, I will use a lower timeframe to determine a good entry and stop loss.
Ideas, not investing / trading advice. Comments welcome. Thanks for looking.

Will communications $XLC lead the next leg up? In the last 6 months AMEX:XLC is the leading sector in the $SPX.
And with the recent sell of in the energy sector AMEX:XLE , communications is the only sector without lower lows.
There are various stocks that confirm this strength in AMEX:XLC , some are NASDAQ:MATH , NASDAQ:ATVI , NASDAQ:META , NASDAQ:CHTR and many others.
Let's wait and see.

$XLC: 65 getting heavyXLC might have a bit more to go to the downside while stocks in the communications sector like GOOGL, NFLX, DIS and META are all acting hesitant imo. We'll see if we continue to get a dip through 65.

XLC - COMMUNICATIONS XLC has and is still one of the strongest sectors.
this is still one of the most skewed ETF's with META's absurd weighting but nonetheless this pattern is still consolidating on the weekly chart.
There is a lower weekly high we have to monitor right at the top of the resistance channel but with if earnings guidance and revisions are met expect the likes of Google and Meta to lift this to the upside target of $74.
Watching weekly close below $64.50 for a bearish setup.
The technical weekly uptrend remains strong but a daily trend has weakened and needs to be monitored for potential accumulation or additional distribution.

XLC: Rebound expected if price falls near 65.5XLC is likely to rebound if price approaches toward 65.5 mark. As long as stock's price holds above 64.5 rising trend may continue toward a range between 72 and 72.9
Bearish signal=64.5
Key level=65.5
Target=72/72.9

XLC (Communications Sector) 1M, 3M, and 6M Technicals OutlookXLC Overview - Communication Services: Companies engaged in the transmission of information, communication, and entertainment, including telecommunications, media, and entertainment companies.
Economic Cycle Sensitivity: Communication services companies are relatively stable and less sensitive to economic cycles. However, their performance can be influenced by changes in consumer behavior, technological advancements, and shifts in media consumption patterns.
Use the analysis of the entire sector on ALL key timeframes (D, W, M, 3M, 6M) with economic factors to make informed decisions for which stocks should be on your watchlist over the next 1,3 and 6 months from this specific sector. Follow price and use structure as confirmation to ensure you're always on the right side of the market.
Top 20 Communication Services Companies:
Alphabet Inc. (GOOGL)
Facebook, Inc. (FB)
Verizon Communications Inc. (VZ)
AT&T Inc. (T)
Comcast Corporation (CMCSA)
Netflix, Inc. (NFLX)
Walt Disney Company (DIS)
Charter Communications, Inc. (CHTR)
Tencent Holdings Limited (TCEHY)
Twitter, Inc. (TWTR)
DISH Network Corporation (DISH)
Baidu, Inc. (BIDU)
Activision Blizzard, Inc. (ATVI)
Electronic Arts Inc. (EA)
Spotify Technology S.A. (SPOT)
Sony Group Corporation (SONY)
NTT DOCOMO, Inc. (DCM)
ViacomCBS Inc. (VIAC)
Liberty Global plc (LBTYA)
Snap Inc. (SNAP)
_________________________________________________________________
XLC - 6M:
The first 6 month candle of the year reversed from a demand zone and closed into a key resistance zone between 64.78 and 67.75, This resistance area was once support and broke below during the formation of the first 6 month candle of 2022.
Scenario 1: If the next 6 month candle is set to break back above resistance, watch for a higher low first that pulls back into the candle during the first few months of its formation, possibly down to 60.23. A bounce should occur on lower TFs to confirm upward movement then a RED 2 GREEN scenario where the candle turns bullish then continues up to break above resistance. Could see a candle close above resistance or you could see a candle close right below resistance with a wick above.
Scenario 2: If the next 6 month candle is set to reject, watch for a look above and fail of the high of the previous 6 month candle (maybe even peak above resistance) … GREEN 2 RED scenario. Another bearish possibility is an immediate breakdown. Which you can once again target 60.23.
_________________________________________________________________
XLC - 3M:
The Q2, 3 month candle is at the same resistance as the 6 month’s. Volume has risen bullish on the last 2 quarter candles. This means XLC is currently bullish.
Scenario 1: If XLC is bullish, watch for the next 3 month candle to retrace at least 27.25 to 38.2% of the previous bull candle before making a move back above the previous 3 month candle then above the resistance area, creating a RED 2 GREEN scenario.
Scenario 2: If XLC if bearish the next 3 months, watch for a reject at the current resistance from the 6 month chart. This could look like another look above and fail scenario, resulting in a GREEN 2 RED candle formation. If this happens then look to target 60.23.
Scenario 3: XLC could also simply trade sideways over the next 6 months (similar to the Q4/3 month candle from 2022 at a major support before making the move up at the beginning of 2023) before making a big move to either direction.
________________________________________________________________
XLC - 1M:
On the 1 month chart of XLC, price has been consistently bullish over the last 4 months. Conversely, the volume has decreased consistently for each previously formed bullish 1 month candle leading up to this resistance area. This observation could further indicate a weakening bull trend. This doesn’t mean a new bearish trend could form but there may be less buying and more consolidation for a while before continuing upward or reversing. The market has to continue digesting the current state of the economy. Which is currently plagued with much uncertainty.
Scenario 1: If bearish, watch for price to break above the previous 1 month candle then break back below, hold, then continue downward. You could also watch for the next candle to reject the highs of the previous one before moving lower. Target the high of the 1 month candle before the previous one. This area could hold as a support. If not, a bearish 1 month candle that closes below the most recent one would indicate a possible trend change overall.
Scenario 2: If bullish, watch for price to either retrace part of the previous candle before moving above or it may have little to no retracement at all and just take off. Depending on how bullish price is moving forward. Although sideways on the weekly chart, the previous week’s chart is strong bull candle with rising volume and bouncing from an uptrend line.
Scenario 3: Again, the market moves in 3 phase, up down, or sideways. So if the next month’s price action is to remain at a stand still, if it will simply trade sideways within the previous months high and low price points. In confluence with this scenario, price is already trading sideways on the weekly chart for past 3 weeks. This may or may not continue, but if there is a break above the highs or lows of the weekly range, watch for a continuation in that respective direction. Wait for price to confirm first (don’t want to get faked out lol).
________________________________________________________________
NOTE: On all timeframes, price is holding above all key EMAs. Also, in confluence in with the major resistance area that XLC is sitting at, price is sitting at the 50% retracement level when using the fib to connect the ATH (all time highs) with the most recent swing low (higher low on the 1M and 3M charts). Lastly, These are all just hypothetical scenarios. The economic has the last say. Understand where we are in the economic cycle by monitoring all economic factors then make a sound judgement before investing into anything.

XLC Sector WCA - Inv HS Sector: Communication Services (XLC)
Introduction:
Hello everyone! Today, we're analyzing the weekly chart of the Communication Services Sector (XLC). After a clear downward trend, we observe a potentially bullish reversal marked by a variation of an inverted head and shoulders pattern.
Inverted Head and Shoulders Pattern:
Typically, an inverted head and shoulders pattern serves as a bullish reversal signal, suggesting a shift from a downtrend to an uptrend.
Analysis:
The XLC's price action has been forming a variation of an inverted head and shoulders pattern over the past 342 days. With a recent breakout above the horizontal neckline at $60, the price is decisively above the 200 EMA, supporting a bullish market environment.
The projected price target based on this pattern is $75, which equates to a potential increase of around 25%. From this analysis, we infer that the Communication Services Sector may outperform in the coming weeks or even months. Therefore, it might be worthwhile to pay closer attention to the individual stocks within this sector.
Conclusion:
The weekly chart of the XLC sector has shown a confirmed bullish reversal signaled by an inverted head and shoulders pattern. With a successful breakout above the neckline already in place, this could indicate a continuing bullish trend, suggesting that it may be an opportune time for long positions in this sector.
As we expect the Communication Services Sector to potentially outperform in the coming weeks or months, investors might consider focus on individual stocks within this sector for investment opportunities.
As always, your own research and risk management strategies should guide your investment decisions.
Thank you for tuning into this analysis. Don't forget to like, share, and follow for more insights into the market. Happy trading!
Best regards,
Karim Subhieh

$XLC inverse head & shoulders AMEX:XLC inverse head & shoulders target is the horizontal line gap fill.

XLC , Long Back in this , not too happy with risk/stop/reward setup , but this was planned to be focused on and until it does something wrong , I buy it . So here goes . I highlighted the nearby resistance which I think is significant and I could see it getting stuck there and visiting lower in the range . But I run on the principle that it's more important to just follow the signal and this is a signal .
