XLF trade ideas


US Financial and Utility Sectors Long TVC:SPX AMEX:XLF AMEX:XLU
Possible growth potential for both XLF and XLU. The greatest deviation between XLF / XLU and S&P 500 before the market drop was ~5%, currently, both sectors are yet to fully recover following the overall trend of the SPX index, looking at an approximate 17% and 14% gain for XLF and XLU respectively in the next 6-8 months.
Supported with the indication of no rate changes proposed by the FED.


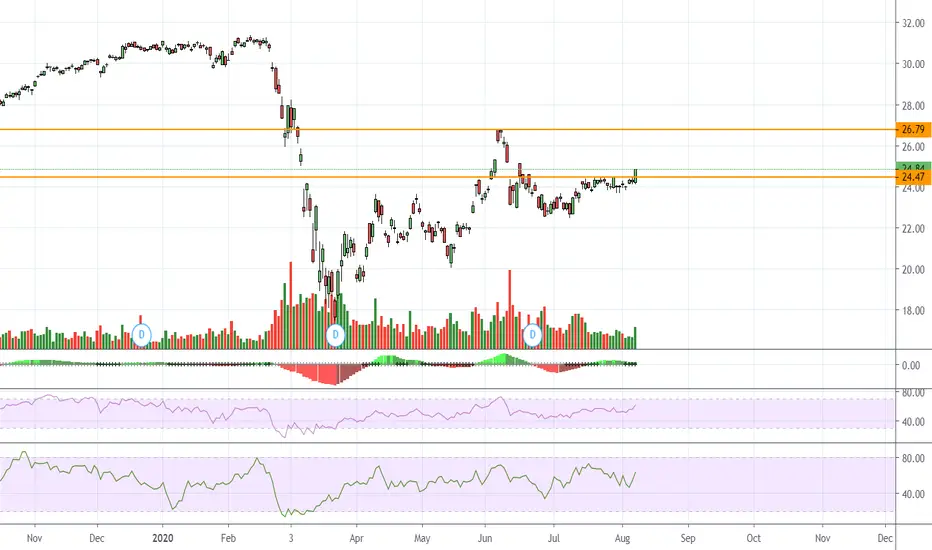
1. Await breakout 2. Lt it pullback 3. Buy3 Simple steps to follow if you want to buy this ETF.
Let the price action breaks out of 23.58 price level acting as resistance.
Next, see if the bullish signals is sustainable , watching the candles closely
If the above criteria meets, buy , put your SL at 19.95. This is assuming you are not trading but wanting to hold for the mid to long term or at least till the trend reverse.

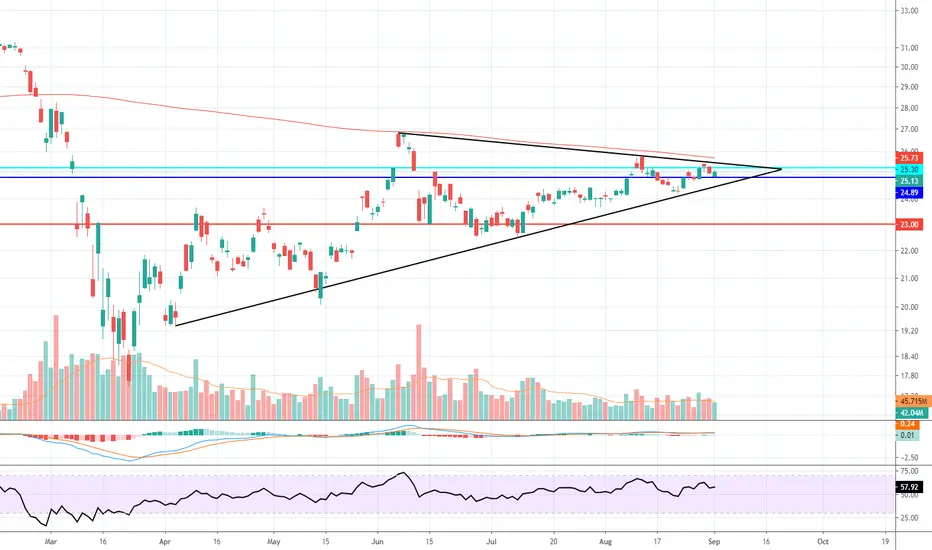


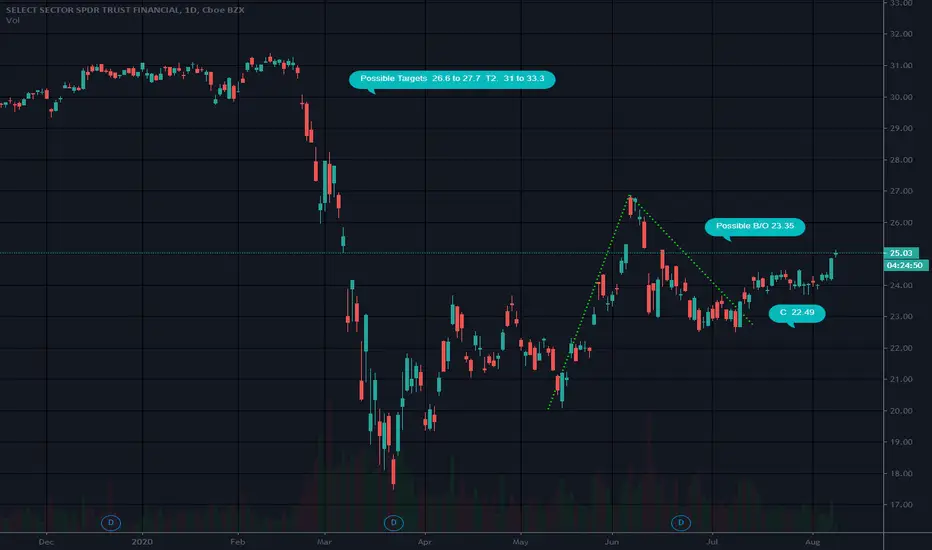
XLF Inverse H&S breakout. As noticed yesterday XLF seems to be trading in series of H&S patterns. We've had a confirmed breakout of the IHS pattern it had been forming.
It appears that the height of the breakout is equal to the previous head. I'm projecting this will run up to touch test the 200 DMA which is around $25.75-25.80

More Head & Shoulders than a shampoo commercial !I normally don't trade off lower time frames. I occasionally chart on the 1 hour, mostly make decisions off the daily and 4hour. Today I happened to focus in on the 5 minute chart and saw what looked like a Inverse H&S forming on XLF.
Then started tracking backwards and it looks like the whole PA has been one series of HS and IHS patterns since the correction in March.
The current one is not complete but would signal a breakout

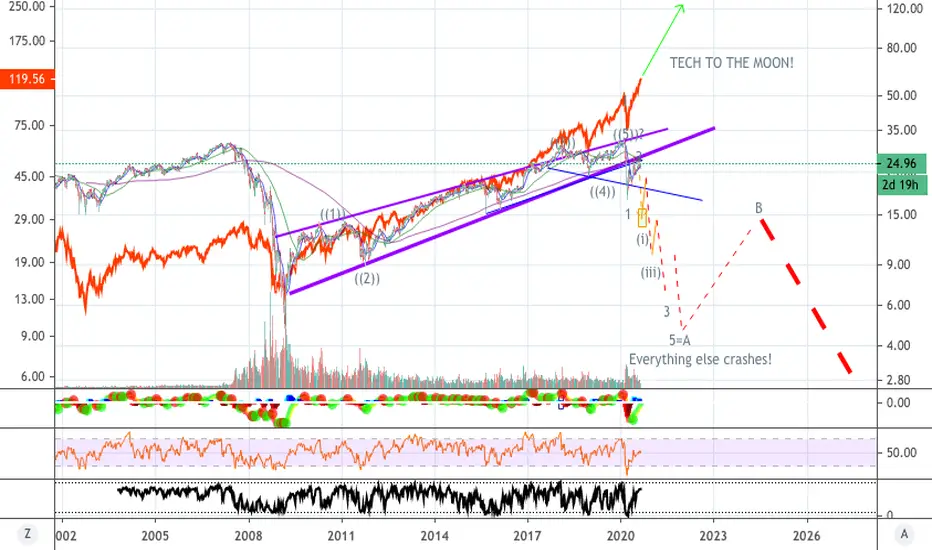
A most insane proposition!I'm not sure many can deny that we are in the most bizarre market the world has ever seen. So, is it possible that tech stocks and especially FAANG-MT will continue powering to the moon and beyond, while everything else crashes?! It's a wild guess but I don't think I've seen anyone draw up a scenario like this one.
(Warning: My downside targets on XLF are a real possibility. The XLK (in red) upside target is arbitrary and not based on any known theory except "up up and away!")
Good luck to everyone!

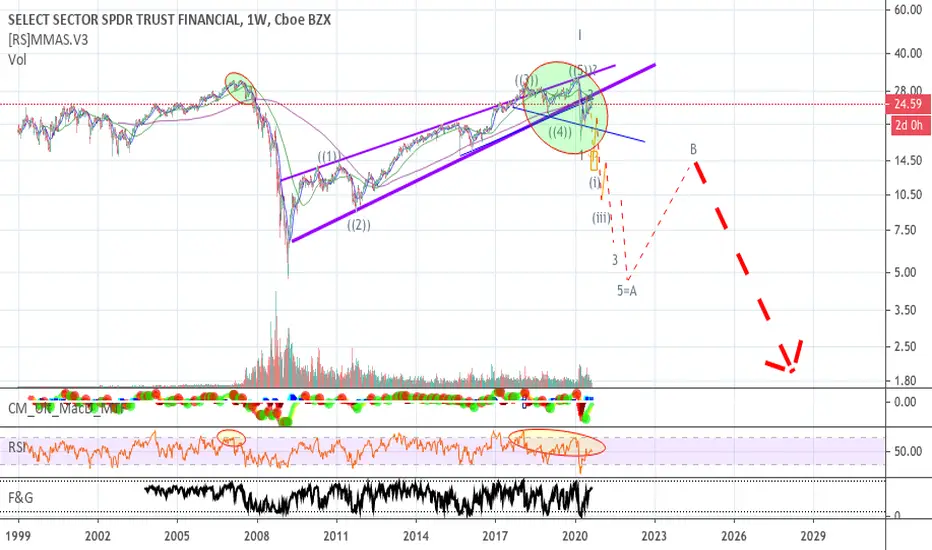
The Great System Reset?I will make one more attempt here to trace out the potential "super cycle" or "grand super cycle" bear market waves that I believe are still about to unfold. I am tired of the distortion caused by tech stocks in the S&P so will use the financial sector directly to try and map it out. Also, if markets truly continue to rise and disconnect from reality then I shall rest my case.
Basically, what I see now is the government and central bank stimulus since the onset of covid sparked an unexpected "new wave" of bullish market players. I don't know exactly who they are, but suspect many of them are associated with the Robinhood application that suddenly exploded with new clients since the March market bottom. This explosion of "belief" in the power of the FED to always "save us" should complete the second wave of the bear market (or final 5th wave of the bull market where technology is strongly present). With respect to market psychology, this should also complete the "complacency" (or Euphoria with respect to tech) stages of market, so the next stages will be the deep declines of the anxiety, denial, panic, and capitulation (although tech may still have a few strong rallies).
If the FED had only started supporting markets since covid arrived, I could see the case for a new bull market. However, they have already supported the market since 2008, including the "repo" efforts prior to covid, and their efforts have done nothing but create an illusion of success, all reflected in the stock markets. In reality, unprecedented levels debt have been created in every asset class imaginable, and wealth disparity is now wider than any time in American history.
Therefore, I still propose that in order for the socio-political and economic structures of the world to restore balance, we will have to eventually endure a near or complete system reset. Although the stock market has still been holding up, we already see huge red flags of the breakdown of these structures in a wide number of global societies (ie. BLM, massive delinquencies and business failures, civil unrest). The market represents the collective sentiment of its players and for some reason, different than other times in history, there remains an extreme sense optimism and infallibility out there. It is like a large group of "dreamers" spurred by the FED's actions truly believe the we can disconnect from reality, accumulate debt and never deal with the real issues out there.
Most traders are looking at the short term picture, but what I write about is a great global upheaval that will take at least a decade to resolve as shown in the charts. It will encompass a multitude of both enormous bull and bear waves, and possibly even complete shutdown of the stock markets.
What can we do?
Well, first look out for each other in the real world.
Second, cash will likely be better than anything.
Third, if you are a bubble player then go ahead and try to ride these rallies.
Forth, ride the bear waves with me if you have the courage. At this point it seems like a folly, so I do not suggest, but heck I try to ride them anyway.
Good luck and I'll begin creating some more shorter posts if we ever start trending down again...


ABC BullishTop 10 Holdings
BRK.B - Berkshire Hathaway Inc Class B14.21%
JPM - JPMorgan Chase & Co10.99%
BAC - Bank of America Corp7.25%
C - Citigroup Inc3.89%
WFC - Wells Fargo & Co3.38%
BLK - BlackRock Inc3.31%
SPGI - S&P Global Inc3.15%
AXP - American Express Co2.30%
GS - Goldman Sachs Group Inc2.29%
CME - CME Group Inc Class A2.22%

XLF daily - a swing trade candidateXLF had a double breakout last Friday (Aug 7 2020) with above average volume . RSI is strong but MACD is negative for now. The plan is to buy it around this level with a stop around $24. Expect to hold it for about a month with $3 to $7 gain per share if it goes well.
