"Analysis of ARB Coin: The Most Popular Layer 2 Right Now"🕵️♂️ Let's dive into analyzing and updating our favorite coin, ARB, which is popular among airdrop enthusiasts. Currently, it's at the market bottom, and its price is undervalued, which might present a good entry point.
🌟 Weekly Updates:
Starting from Monday to Wednesday, we'll cover , Monday: Bitcoin and Dominance analysis , Tuesday: Ethereum and ETH/BTC analysis , Wednesday: Gold analysis
These are in addition to our daily analyses.
🎉 Channel Milestone 800 Followers:
Thank you all for helping this channel reach 800 followers! Our next goal is 1,000 followers. Let's keep growing together!
🎁 Airdrop Insights:
Before diving into the analysis, let's talk about new airdrops. If you're into this domain, it's no longer just about making transactions with a few wallets and winning over $10,000. It requires active participation in the ecosystem, visiting all DEXs, adding liquidity, and increasing TVL within the chain. These activities can lead you to secondary coins related to projects within the chain, potentially yielding more profit than the entire airdrop itself.
The reason I still believe in Arbitrum's success is that despite the unfair distribution of new airdrops and the fact that many left the chain after the airdrop, Arbitrum continues to lead in TVL rankings.
📅 Weekly Analysis:
In the weekly timeframe, we don't have much data due to its recent listing, but we have significant ATH and key supports ahead.
Despite not experiencing a bull run, many Layer 2s had their bull run in 2023, like OP, LDO, IMX, and Arbitrum, all reaching high peaks. LDO, due to its high market cap and solid project, had lesser corrections.
⏰ Currently, we're forming a green support candle on the most crucial support of this chart at 0.7707. Is this a good buying opportunity? In my opinion, no. It's natural to see a green or profit-taking candle after four consecutive red candles. As a friend of mine says, "I prefer not to catch a falling knife."
⏳ Daily Analysis:
In the daily timeframe, we've experienced a strong downtrend. After losing the 0.9284 support, we've now reached the final support level, and we've seen a suitable candle forming at this support, prompting us to shift our focus to the right side of the chart.
If you're a holder of this coin and the market turns bearish, consider exiting and liquidating if we stabilize below the 0.7847 support, as it's likely to be easily lost.
💰 If we return above the 0.7847 resistance, you can buy back in. This time, you'll hold fewer coins, and it's worth setting a stop loss because losing the 0.7847 support means the beginning of a new downtrend. The entry of RSI into oversold territory at 28.84 confirms this.
If you want to buy, you can do so here with minimal risk and without a stop loss. For instance, allocate 1% of your total capital so that if the coin goes to zero, only 1% of your capital is lost. This is justified because the coin is valuable and undervalued. If you need more certainty, wait for it to range between 0.7847 and 0.9284 and buy after breaking the ceiling.
The Fibonacci retracement levels indicate potential correction levels at 0.9284, 1.0351, and 1.2251, unless a ranging scenario changes the cycle.
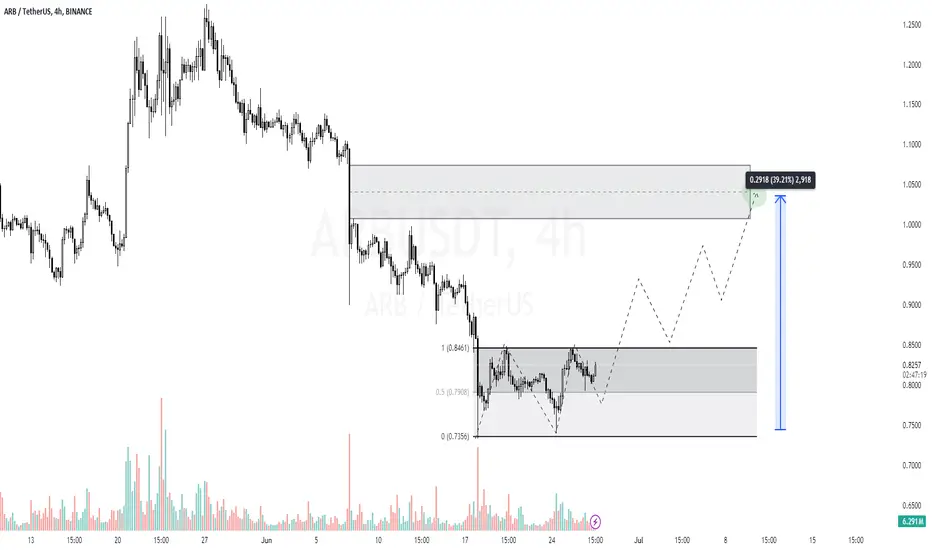
🔄 4-Hour Analysis:
In the 4-hour timeframe, we've had a strong downtrend and are currently fluctuating between the 0.8440 and 0.7670 range, which defines our triggers.
Given that this is the final support level, we can use Fibonacci levels to estimate target levels for breaking the 0.7670 support. The levels are 0.7289, 0.6969, and 0.6662, assuming we bounce back from the 0.236 correction level and break the support.
📉 Short Position Strategy:
Our short position trigger is straightforward. As you can see, volume decreased when correcting upwards. Now, after breaking 0.7670, if volume increases, we open our short position.
📈 Long Position Strategy:
the trend is downward. If we range within the box, we can open a long position by breaking 0.8440 riskily and 0.8906 safely. However, I recommend checking ENS and FET charts for long positions.
🔑 Key Support and Resistance Levels:
Supports Levels: 0.7670, 0.6969
Resistances Levels: 0.8906, 1.0847
😊 If you'd like me to analyze a specific coin or currency pair, be sure to comment so that I can allocate the next analysis for you!
⚠️ Also, please remember that I'm just an analyst, and this isn't financial advice . We're here to stay in the market and maximize profits by adhering to risk and capital management principles.
ARBUSDT.P trade ideas

ARB update (still bearish)Based on the data we have on the chart now, it looks like ARB is in a major correction.
Now we seem to have just entered the C wave.
Wave C is bearish.
In this wave C, the minimum price to which the price can drop is the green box.
In this wave C, the minimum time to pass is the time of the vertical line (November 24).
Closing a daily candle above the invalidation level will violate the analysis
The demand range is indicated by the Fibonacci ratios on the chart.
For risk management, please don't forget stop loss and capital management
Comment if you have any questions
Thank You

Arbitrum Analysis: $10 is possible!ARB has been in a downtrend for almost 4 months, and now it's about to make a CHoCH and start a move upside to make higher highs. I expect the price to hit the support at $0.62 and the ultimate targets are at $5.5 and $10

$$$ARBUSDT, A Massive move is expected very soonHey Trader, Welcome to our cryptocurrency community!
We are going to discussing #ARBUSDT 💹
#ARBUSDT🔥🚀
---------------
⏰Time Frame: 10 HR
#ARB, The triangular pattern formation is done successfully✅👉.
Ready to break the Trend resistance line➡️✅.
In case of a successful Breakout, We are expecting 76% very soon.📈👀
Crypto Analyst Hub
#crypto #cryptocurrency #bitcoin #ethereum #blockchain #btc #cryptotrading #cryptonews #eth #cryptocurrencies #nft #bitcoinnews #bitcoins #trading #bitcoinmining #forex #binance #cryptoart #nfts#trading #forex #trader #investing #stocks #forextrader #stockmarket #daytrader #forextrading #invest #bitcoin #daytrading #cryptocurrency #crypto #investor #investment #forexsignals #nse #chartpattern #cedarforex #candlepatterns #learntrading #bseinstitute #shorttermtrade #bankniftytrading #stockmarketph #calloptions #mqlsignal #futuretrader #tradingmemes #chartpatterns #tradingview #tradinglife #tradinglifestyle #tradingstrategy #tradingtips #tradingplan #tradingsignals #tradingaccounts #tradingsignal #tradingforex #tradingsync #tradingroom #litecoin #ethereum #bitcoincash #cryptocurrencies #ripple #btc #bitcoinnews #bitcoinmining #blockchain #eth #bitcoin #bitcoins #coinbase #cryptocurrency #crypto #bitcointrading #dogecoin
BTC
ETH
USDT
PEPE
DOGE

ARBThe asset is in the buy zone, there is a break in the structure, I expect growth towards imbalance, I indicated the goals on the chart, the growth gap is 50% I’m taking a spot position, like it, I’ll give you more useful ideas!
Strong support | Long BiasOn Week Chart
ARB is testing support zone
On Day Chart
Easily see buying pressure at this support to hold price above 0.73
Wait a bottom with reversal pattern

ARBITRUM - UPDATE - WHEN WILL THE BEARS GIVE UP
This is a critical point for $arbusdt. First is to re-affirm that we are still bearish that is why we are still holding our SHORT position which we used to hedge our spot position. But also, we need to acknowledge at this point that there is one other scenario but it is irrelevant and insignificant there we will keep at this.
On the 1st DCA, it is possible that this move becomes corrective ABC rather than impulsive which means we might not see a new low and the ones waiting for lower will be sidelined. That is the reason for the 1st DCA while the 2nd is an opportunity to bag more ARBITRUM just at Sell-side Liquidity or call it Bear Trap.
We will be offloading our short position on perpetual below and use the proceeds to DCA on our spot. The invalidation level still remain the same. Hope you learn a thing or two. if you do, comment below, drop your opinion or suggestion too.
PREVIOUS ANALYSIS
OTHER ANALYSIS
BINANCE:ALGOUSDT
BINANCE:ADAUSDT
BINANCE:PIXELUSDT
BINANCE:APEUSDT
BINANCE:NOTUSDT

ARB going from weak to strong. M bearbreak no follow through. ARB been strong since BTC flush . Held the lows and starting a intraday bounce.
Setup is M bottom fish after M break no follow through .
Expect a few short to be on it , if it hold they will have to cover.
Scaled in earlier today . Adding back a portion here for a 15m Higher low. maybe get
a risk free entry for M play.

Arbitrum Swing Trade2Day Timeframe + elliot wave count + support and resistances
12h Timeframe + support and resistances
Suspecting the correction is finished and the low is in
Every pullback is an buy opportunity until we break the last high around 2,40 dollar or make an complete 5 wave move to complete wave 3 primary
On the 6h chart looking to enter back in previous rang in a 5 wave move
target is point of control around 1,13 dollar or a possible fake out to the value area high around 1,21 dollar
Stop loss beneath the low in the elliot wave count, otherwise the downtrend continues in wave 5 of wave C on the 2Day chart

ARBUSDTsince IPO lowest close
lets see if multiple bottoms work
red downdtrend is active
next to watch a possible downtrend break up
for this i will be watching increasing daily lows

ARBUSDT Elliott wave countArbitrum sitting on 0.618 fib retracement of wave ((i)) or ((a)) and support of previous low from 0.7390.
Wave ((ii)) or ((b)) an expanded flat correction with wave (c) a 5 waves decline from 2.4250 to 0.7333 that broke below previous low 0.7390.
At this level we are watching for evidences for a possible shift to the upside as oscillators are showing bullish divergence and trend to the downside is showing weakness.
Price must clear 0.9984 and 1.2754 in 5 waves for a wave (i) of ((iii)) or ((c))).
We will post updates soon with an intraday count.
Hit the like button if you like my analysis and follow me for future updates and intraday count!
Good luck!

ARB - 4H Bullish StructureArb looks like it has bottom both on the short term chart and the long term chart (will post that next).
We saw a double bottom form in price between $0.73-$0.74. The second bounce was so strong it created a bullish divergence right off oversold conditions on the 4H timeframe. We saw a similar low in price action followed by a higher low on the RSI.
Our first target would be whenever we test our white trendline (could act as new resistance since it was our old support level). The second target would be the yellow line from a separate trendline.
Once those levels are broken we will see a move to our upper white trendline that would lead us somewhere between $2.50-$3 depending on when we breakout.

ABTUSDT BEST SETUP HERE!!!✅️ in a very convenient area for purchasing
✅️ no signal for price drop visible

ARBITRUM SHORT TRADE SETUP - UPDATE
From psychological point of view - price was going high and they was successful convincing literally everyone that it will continue to go up then all of a sudden they nuke on their euphoria, then those who are a little bit brave to take the short of it are being targeted along the ones who are seeing this a bull run continuation so they take in both ways and finally cause frustration for both short term bulls and bears, then when the price drops to the last leg there is no enthusiasm and that's when the real deal starts.
If you missed entry at first now is your second chance. BINANCE:ARBUSDT
PREVIOUS ANALYSIS
OTHER ANALYSIS
BINANCE:PEOPLEUSDT
BINANCE:RSRUSDT
BINANCE:NEARUSDT
BINANCE:GMTUSDT
BINANCE:RONINUSDT

ARBITRUM Triple Bullish Signal!Arbitrum has seen a significant drop in value over the last few weeks, just like most other alts.
Since ARB is one of the newer alts on Binance, it has an above average growth path ahead of it.
Today I found 3 different "indicators" signaling a potential long-term bottom is in:
- Daily RSI has hit oversold
- Dotted purple support has held
- Bullish divergence on the daily RSI
A single indicator would be tricky to trade, but since all 3 are showing that this might be a great entry for a reversal I'm willing to take the bet.
Stop below the support, target around the current all-time highs.

ARB/USDT POTENTIAL FALLING WEDGE! MUST BOUNCE FROM HERE!!Hey everyone! If you enjoy this content, please consider giving it a thumbs up and following for more analysis.
ARB showing potential on the daily timeframe! We might see a good bounce from here. Buy some here and add more in the dip.
Taregts:- $1.01/$1.24/$1.58/$1.86/$2.28
SL:- Daily close below $0.84
Let me know your thoughts in the comment section.

ARBUSD 1WARB ~ 1W
#ARB This Support Block will be our first purchase. with a short term target of at least 20%+. We are still bullish on this token.
We will continue to accumulate these tokens despite the terrible possibility of losing this support block.

ARB-USDT is ready to go UP!ARB cryptocurrency is in an uptrend structure and has now grabbed the liquidity of the structure's low.
Then if it make a confirmation like SCOB or 1H ChoCh then we could expect it go up to its structure's high at 2.406 dollar.
if it close below the 0.725 then this analysis will be faild.

Arbitrum (ARB) is a hidden gem or scam?Hello, Skyrexians!
Last couple of weeks something bad is happening on the crypto market. It's dumping hard, especially altcoins. Most of the top crypto traders has been waiting for altseason for quite a long period of time, but the result is the opposite. Major exchanges delisted some tokens, which immediately fall below it's critical levels, crypto trading strategies faces with huge losses, most of automated trading bots also hurt deposits, even grid trading bot got stop loss because of price falling below price range. In such a difficult times it's vital to chose the best assets to invest money. Finding such altcoins is important also for automated cryptocurrency trading because it needs enough liquidity. Today we will try to understand if BINANCE:ARBUSDT such asset or not, providing multi time frame analysis using different indicators.
Arbitrium weekly analysis - what Elliott waves are telling us?
Almost all profitable crypto trading strategies are based on Elliott Waves, at least for confirmation trading decisions. On the 1W chart we can see that the first bullish impulse has been obviously finished at $2.43. In my opinion now most of traders shall think that game is over because current dump has almost hit the wave 1 bottom, but waves 2 can retrace up to 100% of the wave 1, especially for such low cap altcoins. ARB is still not bottomed yet, but this bottom is next to.
if this anticipation is true this asset is about to start the impulsive wave 3, which has minimal target at $2.56, most likely at $3.58 and the optimistic one at $5.23. For sure it's not the final target for entire bull market if it will take place, just for wave 3. Extended wave 5 can easily double all these targets, but now it's too early to talk about it.

ARB/USDTdivide the volume of the allocated deposit into three parts
Limit buy zone 0.618 - 30 % 0.786 - 30 % 1 - 30 %
-------------------------------------------------
Take profit zone 0 - 30 % -0.18 , -0.27 - 30 % -0.618 - 30 %

arbAccording to the market conditions and the type of transaction that is spot or futures, in my opinion, let it enter the area and blue lines.

ARBDesigned with you in mind, Arbitrum is the leading Layer 2 technology that empowers you to explore and build in the largest Layer 1 ecosystem, Ethereum

Alt coin beatingAlt coins are highly speculative assets, please buy and sell with caution.
I do like Arbitrum, it’s a top Layer 2 project and should benefit from the upcoming Eth etf. However, the chart looks very bearish and it could continue to drop to $0.75. If that level is lost, I’d be exiting my position and wait for it to stop bleeding.
We appear to be in wave C of the abc correction, so I suspect a turnaround could be on the horizon. But let’s not fight the trend, which continues to the downside. An early indication of a change in market structure is we can climb rhe 0.5 Fibonacci Speed fan (green line). I’ll be watching this closely, slowly accumulating spot position when the time is right.
Not financial advice, just a trade idea.
