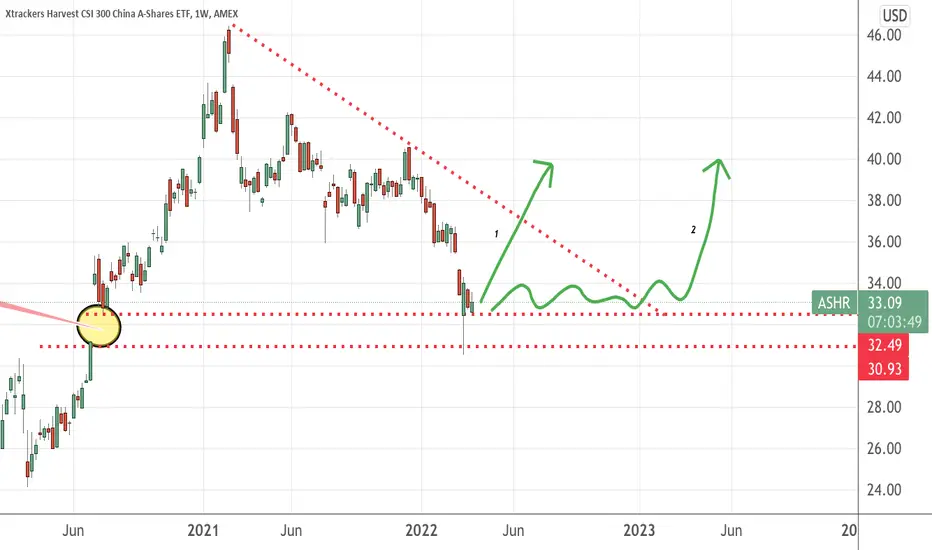
CHINA: LONG-TERM SUPPORT BECOMES RESISTANCEA Long-term Symmetrical Triangle has influenced Chinese stock prices for decades. Breakouts have shown predictable price moves. We are now seeing the first Breakdown.
- 10-Year Support became Resistance earlier this year.
- A lower, parallel, 5-Year Support has broken down and looks to become Resi
Key stats
About Xtrackers Harvest CSI 300 China A-Shares ETF
Home page
Inception date
Nov 6, 2013
Structure
Open-Ended Fund
Dividend treatment
Distributes
Distribution tax treatment
Qualified dividends
Income tax type
Capital Gains
Max ST capital gains rate
39.60%
Max LT capital gains rate
20.00%
Primary advisor
DBX Advisors LLC
Distributor
ALPS Distributors, Inc.
ASHR was the first US-listed China ETF capable of accessing the China A-share market directly. The fund is able to hold A-shares in the Shanghai and Shenzhen Stock Exchanges through the subadvisor, Harvest Global Investments, which has an RQFII license up to a specific quota. If the quota is reached, the index will have to either get its quota increased, use derivatives to maintain exposure, or limit or halt creations, so monitoring is warranted. The funds focus on mainland A-shares also gives it a large-cap tilt and a heavy bias toward financials. The RQFII quota can make creations difficult. The index is reviewed semi-annually.
Classification
What's in the fund
Exposure type
Finance
Producer Manufacturing
Electronic Technology
Stock breakdown by region
Top 10 holdings
Symbol
Assets
Symbol
Assets
6
Kweichow Moutai Co., Ltd. Class A600519
4.86%
3
Contemporary Amperex Technology Co., Limited Class A300750
3.35%
6
Ping An Insurance (Group) Company of China, Ltd. Class A601318
2.76%
6
China Merchants Bank Co., Ltd. Class A600036
2.69%
0
Midea Group Co. Ltd. Class A000333
1.86%
6
China Yangtze Power Co., Ltd. Class A600900
1.82%
0
BYD Company Limited Class A002594
1.63%
6
Industrial Bank Co., Ltd. Class A601166
1.61%
6
Zijin Mining Group Co., Ltd. Class A601899
1.44%
3
East Money Information Co., Ltd Class A300059
1.32%
Top 10 weight23.35%
286 total holdings
No news here
Looks like there's nothing to report right now

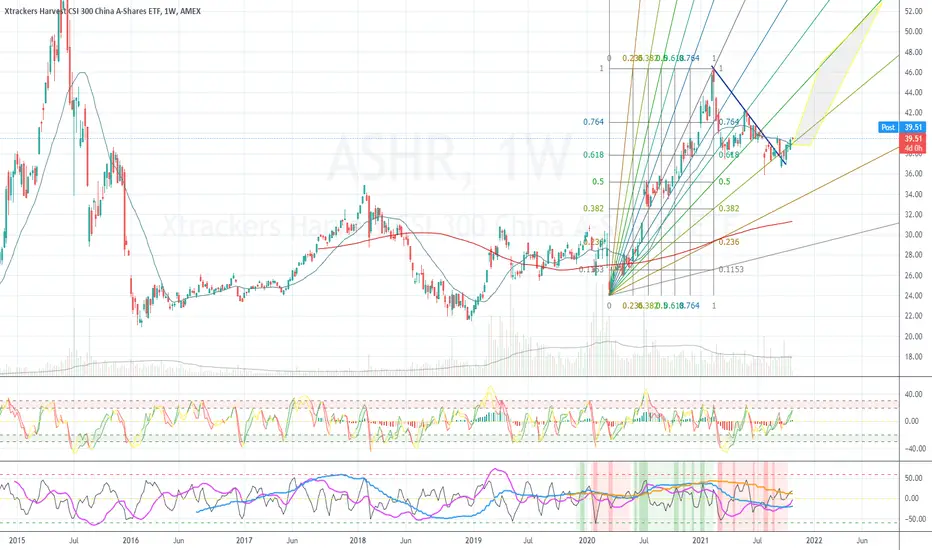
Chinese SSE300 Index ETF: Bearish Dragon with 1.618 TargetThis is an extension to the Bearish SSE50 setup that I posted not so long ago; I found a tradable US Listed ETF that tracks the movement of the SSE300 and the situation on this chart is pretty much the same as the one for the SSE50 where we are breaking a logarithmic trendline, the moving averages,

ASHR (also EEM, CQQQ, MCHI) Longer Term BullishI bought ASHR, but all these Chinese related names look like they are building a base to move higher from. I'd like to see it try to maintain the 20MA as some support, but if it doesn't, it's not a deal breaker.
EEM has the best options, so I might be adding something from that eventually.
"Panda Bear" coming out to playThis is straight from my meditation. I was trying to ask about the market and getting distracted, but as soon as I came back to quiet, I received, "panda bear". I thought maybe it's a company or mascot until I actually googled it.
This is in alignment with a LITERAL bear that visited a cabin we wer


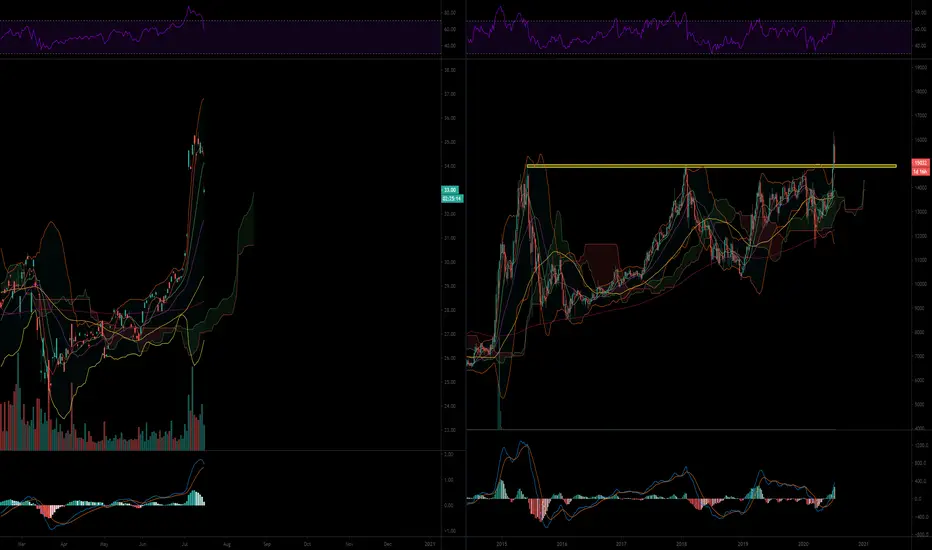

ASHR strong breakoutThis one is more longer term and could be a BTFD play in the coming weeks/months. Would be one of my major play for the remainder of the year as long as the yellow area in relative performance chart is hold.
Fundamentally, it is more of play who will recover first from COVID-19.
Weekly volume is


See all ideas
Summarizing what the indicators are suggesting.
Oscillators
Neutral
SellBuy
Strong sellStrong buy
Strong sellSellNeutralBuyStrong buy
Oscillators
Neutral
SellBuy
Strong sellStrong buy
Strong sellSellNeutralBuyStrong buy
Summary
Neutral
SellBuy
Strong sellStrong buy
Strong sellSellNeutralBuyStrong buy
Summary
Neutral
SellBuy
Strong sellStrong buy
Strong sellSellNeutralBuyStrong buy
Summary
Neutral
SellBuy
Strong sellStrong buy
Strong sellSellNeutralBuyStrong buy
Moving Averages
Neutral
SellBuy
Strong sellStrong buy
Strong sellSellNeutralBuyStrong buy
Moving Averages
Neutral
SellBuy
Strong sellStrong buy
Strong sellSellNeutralBuyStrong buy
Displays a symbol's price movements over previous years to identify recurring trends.