AVR – 30-Min Long Trade Setup!📌
🔹 Asset: Anteris Technologies Global Corp. (AVR)
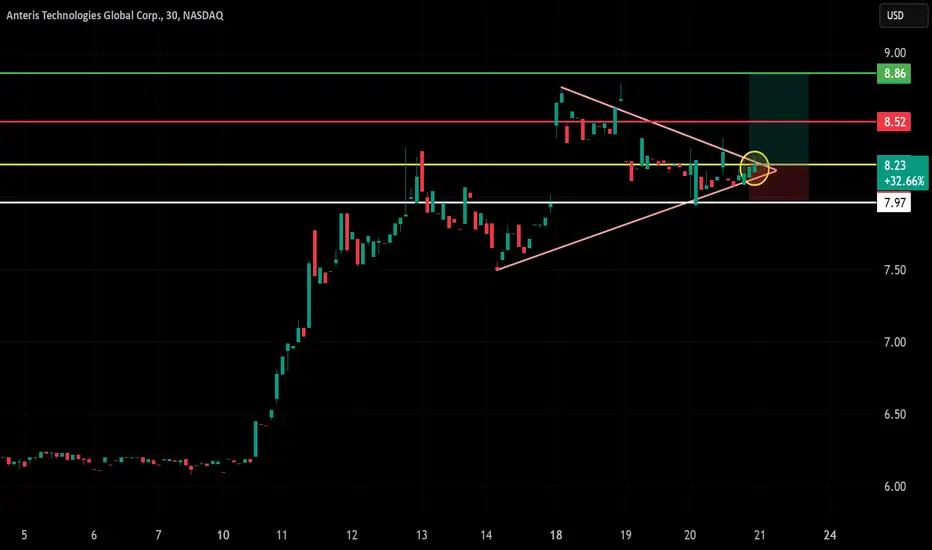
🔹 Timeframe: 30-Min Chart
🔹 Setup Type: Symmetrical Triangle Breakout Long Trade
📌 Trade Plan (Long Position)
✅ Entry Zone: Above $8.23 (Breakout Confirmation)
✅ Stop-Loss (SL): Below $7.97 (Break of Support & Trendline)
🎯 Take Profit Targets
📌 T
ANTERIS TECHNOLOGIES GLOBAL CORP.
7.15AUDD
−0.30−4.03%
At close at 06:10 GMT
AUD
No trades
Next report date
≈
August 21
Report period
Q2 2025
EPS estimate
−0.87 AUD
Revenue estimate
—
−3.49 AUD
−115.66 M AUD
4.10 M AUD
33.93 M
About Anteris Technologies Global Corp.
Sector
Industry
CEO
Wayne Geoffrey Paterson
Website
Headquarters
Eagan
Founded
1999
ISIN
AU0000088841
FIGI
BBG01PLXJ6N8
Anteris Technologies Global Corp. is a structural heart company, which engages in the development and commercialization of medical devices for heart diseases. It operates through the following geographical segments: United States, Germany, Australia, Switzerland, and Sweden. The company was founded in 1999 and is headquartered in Eagan, MN.
−4,000.0%
−3,500.0%
−3,000.0%
−2,500.0%
−2,000.0%
Q1 '24
Q2 '24
Q3 '24
Q4 '24
Q1 '25
−36.00 M
−24.00 M
−12.00 M
0.00
12.00 M
Revenue
Net income
Net margin %
Revenue
COGS
Gross profit
Op expenses
Op income
Non-Op income/ expenses
Taxes & Other
Net income
−36.00 M
−24.00 M
−12.00 M
0.00
12.00 M
Revenue
COGS
Gross profit
Expenses & adjustments
Net income
−36.00 M
−24.00 M
−12.00 M
0.00
12.00 M
Q1 '24
Q2 '24
Q3 '24
Q4 '24
Q1 '25
−40.00 M
0.00
40.00 M
80.00 M
120.00 M
Debt
Free cash flow
Cash & equivalents
No news here
Looks like there's nothing to report right now
Summarizing what the indicators are suggesting.
Neutral
SellBuy
Strong sellStrong buy
Strong sellSellNeutralBuyStrong buy
Neutral
SellBuy
Strong sellStrong buy
Strong sellSellNeutralBuyStrong buy
Neutral
SellBuy
Strong sellStrong buy
Strong sellSellNeutralBuyStrong buy
An aggregate view of professional's ratings.
Neutral
SellBuy
Strong sellStrong buy
Strong sellSellNeutralBuyStrong buy
Neutral
SellBuy
Strong sellStrong buy
Strong sellSellNeutralBuyStrong buy
Neutral
SellBuy
Strong sellStrong buy
Strong sellSellNeutralBuyStrong buy
Displays a symbol's price movements over previous years to identify recurring trends.