ATOM range moves $ATOM since its in a range oone of the moves i expect is this. lets see what happens
ATOMBULLUSD trade ideas

ATOMUSD ❕ ATOM under liquidityATOM came out of the range downwards and continued to move in the descending channel, returned to the lower boundary of the range.
The price is under liquidity, near the upper boundary of the downward channel.
The last growth impulse happened on declining volumes.
The main MAs on the 4H Timeframe are bearish.
I expect that the price will test the upper border of the channel, and after fixing under it will continue to decline.

Bears Scammed?This correction is looking to be near over or already over - break of our channel to the upside will confirm this correction has completed.

Falling Wedge Almost CompleteATOM forming a textbook falling wedge at the summer 2021 range lows. Two scenarios:
(1) Breakout to the upside towards $12-15 resistance pretty soon
(2) Brief breakdown below wedge (stop hunt) and swing around towards $12-15 shortly after
Zoom out and keep the big picture in mind. The entire market is very extended to the downside in the near-term. A bear market rally, at the very least, should be expected. Inverting the chart can give you perspective as well.


Harmonic Pattern- DEEP CRAB - A great example on ATOM WEEKLY You can't get better than anything at this level when it comes to Harmonic pattern, it is complete Deep Crab pattern at 1.618 extension which also sits at a critical support level if u were to look back in time. That is price action has been respecting the support zone at D for quite some time. RSI has been sitting oversold same as Stochastic RSI, they have bottomed out, MACD is slowly becoming positive. On a weekly perspective this is a good set up for a green week- of course only when BTC dumps things are otherwise.

Long on ATOM High RiskIt is a high-risk trade with the following set-up and targets goals:
LONG ATOM x5
High Risk❗️
Entry: 9.285
SL: 9.149
TP1: 9.428
TP2: 9.517
TP3: 9.649

ATOM/USD 1D. The situation right now on the coin.#ATOM/USD 1D Binance. Updated the coin idea. I made a "global" analysis and described the situation for you.
Now I will describe it in text here. Pay attention to the interesting name of the coin - COSMOS (ATOM) . Here is an analogy similar to Terra (Luna). I think everything is clear here. The cosmos is big, the Atom is small (the particle that makes up the Cosmos and our material world as a whole). Hyperlink left the project page in CoinMarketCap.
This coin has been in accumulation since 2019 (history from the Binance exchange chart). Accumulation ~ 2 years.
After accumulation, an impulse occurred, the distribution began exactly near the accumulation goal (the average distribution price is the exact accumulation goal). Showed on the graph.
Also note how clearly the price "respected" (that is, reacted) to this level afterwards (a clear retest when breaking the distribution). I also painted it on the chart.
After leaving the accumulation, a large horizontal channel began to form (shown on the chart). Similar to Bitcoin (consolidation/sideways with lower and upper boundaries).
After the distribution in this horizontal channel (shown on the chart - Distribution), the price has clearly reached the goal of this distribution (also displayed on the chart).
An ascending triangle (rising lows and a flat top) was also formed in this large channel, which was subsequently broken down.
If this triangle works out, its goals are shown on the chart.
It is also worth noting that from the minimums of the accumulation, an upward trendline (purple) began to form, which was very jewelerishly broken down just when leaving the accumulation. There was a retest of this trendline.
All this is shown on the chart.
After the breakout and retest of the ascending trendline from the bottom up, a descending trend of the secondary trend began to form (red on the chart, also designated it - the secondary trend line).
If there is a breakdown of this trend - a reversal of the secondary trend to an upward one (breakout + the proof of breakout / retest).
Now the price is consolidating in a small range at the lower border of the large horizontal channel (possibly a repeat as in the summer of 2021). Pay attention to this point on the chart.
The price from the average values of a large accumulation is still at a good profit (now 155% as shown). That is, those who have accumulated are still in the black. Therefore, there is still a place to sell.
Also note that the volume gradually began to appear. And what this volume was at the peak of the fall (capitulation).
Potential levels from below as well as from above are shown on the chart.

Cosmos Crypto Worldwide Sun Storm Investment Trading Desk & NexGen Wealth Management Service Present's: SSITD & NexGen Portfolio of the Week Series
Focus: Worldwide
By Sun Storm Investment Research & NexGen Wealth Management Service
A Profit & Solutions Strategy & Research
Trading | Investment | Stocks | ETF | Mutual Funds | Crypto | Bonds | Options | Dividend | Futures |
USA | Canada | UK | Germany | France | Italy | Rest of Europe | Mexico | India
Disclaimer: Sun Storm Investment and NexGen are not registered financial advisors, so please do your own research before trading & investing anything. This is information is for only research purposes not for actual trading & investing decision.
#debadipb #profitsolutions

ATOMUSD ❕ price in liquidity zoneATOM is down in the liquidity zone.
Price dropped below the MAs on the 30m Timeframe.
I expect that after fixing under the resistance level, the price will continue to decline.

Cosmos a.k.a. ATOM - 1 Month Ahead Trading Idea - 21 May 2022COINBASE:ATOMUSD in the past 50 days made a big decline of over 75% and its a good moment for accumulation in the short-medium term time frame. Good news coming out for the ATOM ecosystem and a potential upside of 100% is very likely to happen even in 1 month period.
What is the supported thesis technically for the expected scenario on ATOM?
- There are big liquidation holes to be filled upside and the first strong resistance is at $22.00 per coin
- The MACD indicator hits low points and soon will start its explosive on the upside
- Wedge concentrate price action and soon will break out with huge price action
- Breaking of downside dynamic trendline should be a reality in the beginning of June
If you have any questions related to this trading idea I will be happy to provide you with answers.

ATOMUSD ❕ above liquidity zoneATOM is out of the downward channel.
Volatility has declined.
Drawdowns in the liquidity zone were repaid with an increase in trading volumes.
I expect that the price may continue to grow with fixing above the resistance level.

ATOM ANALYSISOn the 4 hours time frame of ATOMUSDT, the price is forming a rising broadening wedge which may indicate a continuation of the drop if we broke the support downwards.
Take a look at the Bollinger indicator it is shrinking which gives us more indication that a big movement in the price is going to happen

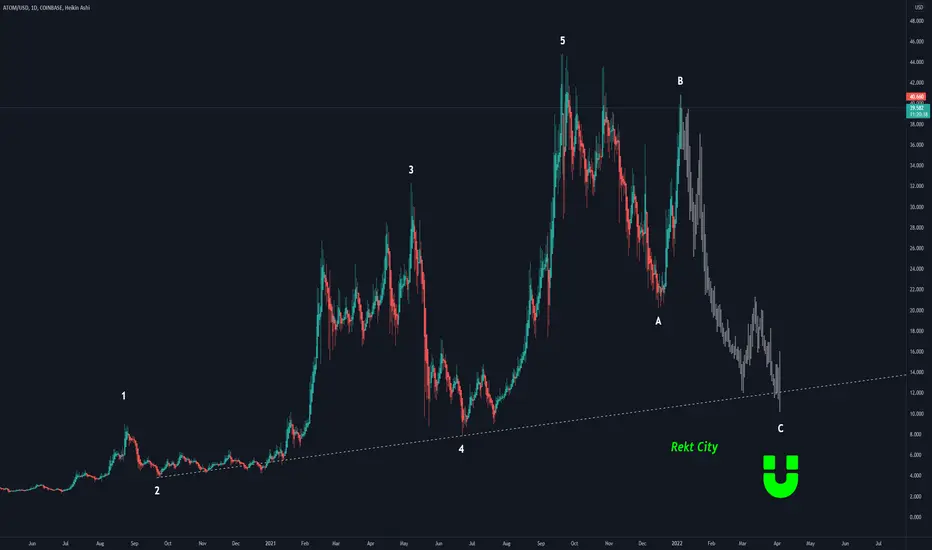
Bull Traps Everywhere...Another day ATOM is scamming higher as the top longers and future bagholders rejoice of their short term gains - These people are now crypto experts overnight, SIKE this is going to fall so hard and leave many with a 1 way ticket to rekt city.
$ATOM Might be ready to go LONG!ATOM has been trying to recover since the LUNA mess. A break above $11.90 and it might get rolling.

ATOM looking for some relief bull pushATOM, just like most other coins still has a bearish market structure on the daily timeframe. But 4H is successfully holding a bullish market structure. I'm expecting a push upwards towards the golden pocket of the recent downward move, peaking at max at $15.
We might see a range shift afterwards, meaning a confirmation of the current overall bottom, but I am expecting another push to the lows, since most coins are building up a massive hidden bear divergence.

ATOM/USDT - Short ScenarioHello Traders!
After long price distribution in the range of $22.00 - $44.00 ATOM passed to the falling phase.
In case of continuation of descending dynamics of market movement it is possible to expect the further movement of price of assets to the following levels of support.
For medium-term purchases at the moment there are no comfortable prices. It is better to begin the set of assets after decrease in the price to a zone of interest of buyers $4.50 - $6.35. It is best to place buy orders near the support level of $4.50, it can be price values of $4.20 - $5.00.
Good luck and watch out for the market
P.S. This is an educational analysis that shall not be considered financial advice

ATOM ANALYSISOn the 15 minutes chart, ATOMUSDT is forming a falling wedge which may indicate a reversal.
If we take a look at the RSI we can see a divergence where the price is forming lower lows and the RSI is forming higher lows.

ATOMUSDTPERPffffffffffffffffffffffffffffffffffffffffffffffffffffffffffffffffffffffffffffffffffffffffffffffff

atom/cosmos aiming for 5.8-3.5 atom has fallen alot since break of upper imp level which is exactly why we need a retest to the bottom or above or in between the lower imp level. theres a big liquidity pool in below levels which will exactly help us to break the imp levels and resistance.

ATOM Recovery Atom look like it pulled back from low of $8 we and up already we may see bullish in a few weeks. This coin will let you get a 5%+ APY on some of the exchanges. This one have not change since. This coin have High potential for it to recover back to $40. RSI way over sold in the 3 day time frame. Resistant in at the $10. The market is making a recover after fear.

best time soon coming soon for atomThe downtrend of the market with severe falls can have a quick return. In my opinion, whenever the support is confirmed, they can start buying a step by step

Atom longHello,we completed the pattern and bounced off the weekly support with liquidity. Very often after the completion of the pattern, the market turns around and gets back to the pattern again.Good Luck
