Sell GBPAUD H&S PatternSell GBPAUD H&S Pattern in m30
Entry @ 1.9054
TP - 1.8950
SL - 1.9110
Thank you
AUXGBP trade ideas

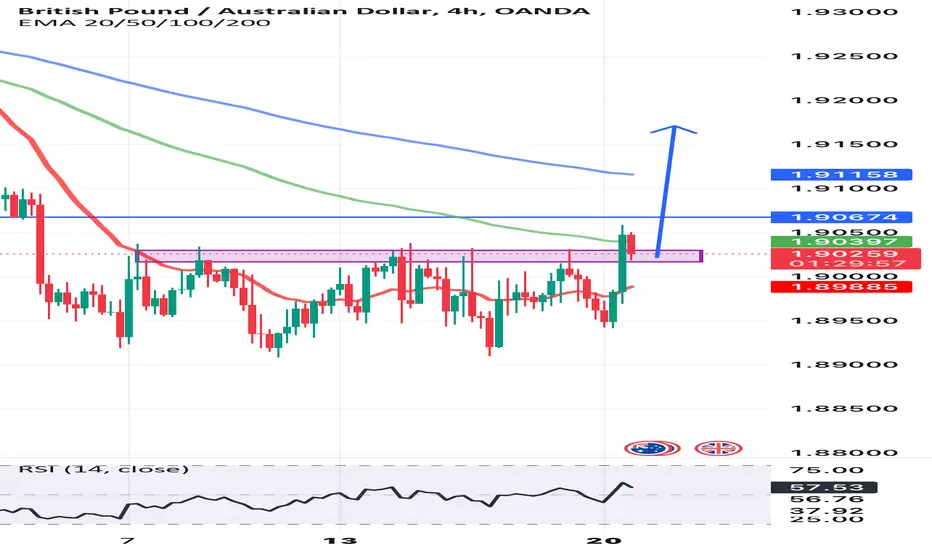
GBPAUD: Bullish Reversal Now Confirmed?!Update for 📈GBPAUD.
The GBPAUD price has successfully surpassed and closed above the resistance level of a narrow horizontal range and a declining trend line on a 4-hour chart, signaling a strong bullish trend.
The broken resistance is now turned to support
Taking into consideration that the market has been consolidating for the past two weeks, it is expected that the pair will continue to increase in the coming days. The next objectives to watch for are 1.9098 and 1.9152.


GBPAUD SELL | Idea Trading AnalysisGBPAUD is moving in a descending channel between the trend lines and Resistance area. Is near the resistance, where price dropped before.
We expect a bearish move from the confluence zone.
Hello Traders, here is the full analysis.
I think we can soon see more fall from this range! GOOD LUCK! Great SELL opportunity EURJPY
I still did my best and this is the most likely count for me at the moment.
-------------------
Traders, if you liked this idea or if you have your own opinion about it, write in the comments. I will be glad 🤝

GBPAUD: Your Trading Plan For This WeekFollowing a breakout of an important daily horizontal level, GBPAUD is currently consolidating within a horizontal range on a 4-hour timeframe.
Traders seeking a short-term selling opportunity should watch for a bearish break of the range's support, with a 4-hour candle closing below 1.890 providing a strong confirmation for a bearish trend.
In this scenario, a bearish move towards the 1.8800 level can be expected.
⚠On the other hand, a bullish breakout of the range's resistance could signal a potential uptrend continuation.

GBPAUD Long Setup1.GBPAUD broken the current trendline but hasn't crossed 200 EMA yet. So we have to wait for it.
2.Once we got the confirmation we can take an entry for Long from the support zone.
3.Recent AUD negative news may impact against GBP after a huge a Short. This might be a reversal for a GBPAUD.

GBPAUD bullish rally..hey guys heres what i am looking at on GA. with the pound strength over the Aussi, and a beautiful hand and shoulder pattern being formed, i am expecting price to go the upside. personally i am long on GA.

GBPAUD PLAYED OUT AS I PREDICTEDPSTG 1& 2 were hit after 3 weeks,
One of the most hard weeks of my trading career

GBPAUDGBP/AUD is the abbreviation for the British Pound and Australian Dollar pair. It shows how much the GBP (base currency) is worth as measured against the AUD (counter currency)

GBP/AUD SHORTGBP/AUD SHORT " break of structure + 72% fib retracement + daily resistance with 50% fib retracement "


Potential GBP/AUD Sell Trend Continuation Opportunity. I will be looking to take a sell trade from around the 1.91000 level expecting a trend continuation looking for price to fall into 1.86500 level over the next few weeks.
From a technical perspective a long term trendline has been broken on the Daily / Weekly timeframe.
The market is bearish on the monthly timeframe.
A stop loss above 1.92000 would seem to be a great protective area with a strong level of resistance formed on the 4HR timeframe.

GBPAUDGBPAUD has broken above the trendline following an accumulation zone, indicating a potential upward movement. This bullish outlook is reinforced by the break of the lower high (LH). A prudent stop-loss placement would be just below the newly established higher low (HL)

GBPAUD 30Mins Intraday Bullish:
*. Trend Line Break:The price has broken and is trading above a previously declining trend line. This indicates a potential shift from a bearish to a bullish trend.
*. Horizontal Structure Break:On the 1-hour (1H) timeframe, the price has also broken and closed above a significant horizontal resistance level. This further confirms the bullish momentum.
*. Expectation:Based on the above technical signals, there is an anticipation that the price will continue to rise towards the target level of 1.90250.
Action Plan:Monitor the price action for any pullbacks or retests of the broken horizontal structure or trend line, which could serve as potential entry points for long positions.Set stop-loss orders below the recent low or the broken horizontal resistance to manage risk.Consider partial profit-taking or trailing stop strategies as the price approaches the target level of 1.90250. (Good luck 🤞🤞)

GBPAUD SELLGot a 3m BoS on the 15/3m order block
Price has pulled back to .786 OTE
TP 1 is Green line


Buy GBPAUD Triangle BreakoutThe GBP/AUD pair on the M30 timeframe presents a Potential Buying Opportunity due to a recent breakout from a Triangle Pattern. This suggests a shift in momentum towards the upside and a higher likelihood of further advances in the coming hours.
Possible Long Trade:
Entry: Consider Entering A Long Position Above The Broken Trendline Of The Triangle After Confirmation. Ideally, This Would Be Around 1.9235.
Target Levels:
1st Resistance – 1.9334
2nd Resistance – 1.9400
Stop-Loss: To manage risk, place a stop-loss order below 1.9180. This helps limit potential losses if the price falls back unexpectedly.
Opportunity Breakdown:
Triangle Breakout: Price action recently broke above a bullish triangle, a continuation pattern suggesting further upside potential.
Retest Confirmation: The price has retested the broken resistance line of the triangle and held, indicating strong buying pressure. This retest adds confidence to the breakout.
Ichimoku Cloud Support: The current price sits comfortably above the Ichimoku cloud, a technical indicator that often signals bullish momentum when the price is above the cloud.
Thank you.

GBPAUD Turned bullish ?Today GBP's CPI was good and it just broke a minor trendline however it's still behind 200EMA though

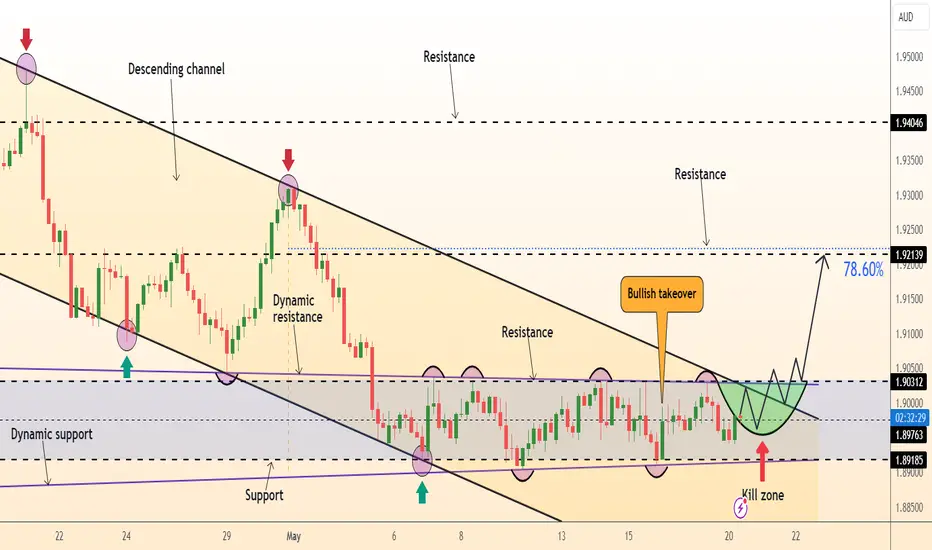
DeGRAM | GBPAUD trading on a range breakoutGBPAUD is moving in a descending channel between the trend lines.
The chart is trading in the range between the levels. The longer the price stays in the upper half of the range, the more likely an upward breakout.
After reaching the support, the pair formed a bullish takeover.
We expect growth after the breakout of the range.
-------------------
Share your opinion in the comments, and support the idea with a like. Thanks for your support!
Could GBP/AUD reverse from here?Price is rising towards the pivot which has been identified as an overlap resistance and could reverse to the 1st support.
Pivot: 1.9313
1st Support: 1.9093
1st Resistance: 1.9429
Risk Warning:
Trading Forex and CFDs carries a high level of risk to your capital and you should only trade with money you can afford to lose. Trading Forex and CFDs may not be suitable for all investors, so please ensure that you fully understand the risks involved and seek independent advice if necessary.
Disclaimer:
The above opinions given constitute general market commentary, and do not constitute the opinion or advice of IC Markets or any form of personal or investment advice.
Any opinions, news, research, analyses, prices, other information, or links to third-party sites contained on this website are provided on an "as-is" basis, are intended only to be informative, is not an advice nor a recommendation, nor research, or a record of our trading prices, or an offer of, or solicitation for a transaction in any financial instrument and thus should not be treated as such. The information provided does not involve any specific investment objectives, financial situation and needs of any specific person who may receive it. Please be aware, that past performance is not a reliable indicator of future performance and/or results. Past Performance or Forward-looking scenarios based upon the reasonable beliefs of the third-party provider are not a guarantee of future performance. Actual results may differ materially from those anticipated in forward-looking or past performance statements. IC Markets makes no representation or warranty and assumes no liability as to the accuracy or completeness of the information provided, nor any loss arising from any investment based on a recommendation, forecast or any information supplied by any third-party.

Could GBP/AUD bounce from here?Price is falling towards a support level which is an overlap support that aligns with the 50% Fibonacci retracement and could potentially bounce from this level to our take profit.
Entry: 1.90167
Why we like it:
There is an overlap support which lines up with the 50% Fibonacci retracement.
Stop loss: 1.89433
Why we like it:
There is a pullback support level.
Take profit: 1.91494
Why we like it:
There is a pullback resistance level which aligns with the 61.8% Fibonacci retracement.
Please be advised that the information presented on TradingView is provided to Vantage (‘Vantage Global Limited’, ‘we’) by a third-party provider (‘Everest Fortune Group’). Please be reminded that you are solely responsible for the trading decisions on your account. There is a very high degree of risk involved in trading. Any information and/or content is intended entirely for research, educational and informational purposes only and does not constitute investment or consultation advice or investment strategy. The information is not tailored to the investment needs of any specific person and therefore does not involve a consideration of any of the investment objectives, financial situation or needs of any viewer that may receive it. Kindly also note that past performance is not a reliable indicator of future results. Actual results may differ materially from those anticipated in forward-looking or past performance statements. We assume no liability as to the accuracy or completeness of any of the information and/or content provided herein and the Company cannot be held responsible for any omission, mistake nor for any loss or damage including without limitation to any loss of profit which may arise from reliance on any information supplied by Everest Fortune Group.

AUDCHF 4H*). Consolidation Phase:The price has been consolidating for some time, indicating a period of market indecision. During this phase, the price is likely to oscillate within a defined range without a clear trend direction.
*). Breakout with Momentum:Recently, the price broke out of a horizontal structure with a substantial momentum candle on the 4-hour (4H) timeframe. This breakout suggests a strong shift in market sentiment and a potential end to the consolidation phase.
*). Target Resistance Level:Following the breakout, there is an expectation for the price to grow towards the 1.92500 resistance level. This target is likely based on historical price action, where the 1.92500 level has previously acted as a significant resistance.
The recent breakout from consolidation with a strong momentum candle on the 4-hour timeframe suggests a bullish trend. The anticipated movement towards the 1.92500 resistance level will be a critical point to watch for further price action signals. (Good Luck 🤞🤞)
