bandbtcBand Oracle Project
After a long correction, it is ready for a good parabolic movement. I hope you don't miss this position
BANDBTC trade ideas

Band Protocol Long-Term Support Holds (380% Bullish Wave Mapped)Since June 2023 we have at least 9 attempts by the bears to break support, failing every single time—this is the yellow space on the chart.
As the current session has a long lower wick, this means that BANDBTC manages to close above support once more and at the same time produces a higher low.
While still trading below EMA10 (which is bearish), the fact that support holds is good for the bulls.
This is an early signal.
We are looking at bottom pricing, potentially.
Huge potential for growth long-term.
Easy and big as well in the short- to mid-term.
Targets can be found on the chart.
Thank you for reading.
Namaste.

✳️ Band Protocol 120% Rise MappedBand Protocol (BANDBTC) is preparing to print a very nice, and potentially profitable, bullish wave.
I say this based on the fact that a strong support level has been established.
BANDBTC hit a low 10-June. This low has been tested multiple times and continues to hold.
After 6 months consolidating between 3300 and 3900 sats, it is ready to move forward.
The details can be easily spotted on the chart.
➖ A recent falling wedge;
➖ A challenge of EMA300;
➖ A final retest of support...
Yesterday's candle is only the beginning, this pair is preparing for strong bullish growth.
Namaste.

BandBtc buy opportunityBandbtc is currently showcasing a falling wedge formation on the chart, with the price rebounding consistently from the bottom trendline. Considering the wedge's contraction, the setup suggests an imminent price breakout.
The immediate level to monitor is the internal supply zone (ISZ), anticipated to act as robust resistance. However, post-breakout, the price is expected to exhibit significant strength, potentially allowing it to breach the ISZ after initial testing.
The chart indicates a strong accumulation zone, presenting an opportune area for buyers to accumulate positions. To manage risk, it's advisable to implement stop-loss orders in case of unexpected price movements.
It's an essential risk management tool to protect against adverse market movements. Don't forget to hit the 'like' button if you find this analysis helpful.
Your feedback and comments are appreciated. Thank you.

Band Protocol (BAND) - Bullish divergenceOn the above 2-day chart price action has corrected 90% since the sell signal back in July 2020 following a massive 5500% from the buy signal in January 2020. A number of reasons now exist to be bullish, including:
1) Really? You don’t see it?!
2) Price action has corrected to the 0.786 Fibonacci level, which is also support on past resistance. Look left.
3) Regular bullish divergence. Multiple oscillators are currently printing bullish divergence with price action. It is clearer to see on the 1-day USD chart below.
4) On 'what if' list.
Is it possible price action falls further? For sure.
Is it probable? Very unlikely.
Ww
1-day USD chart bullish divergence
Type: trade
Risk: <=6% of portfolio
Timeframe: 3 to 6 months
Return: 20x

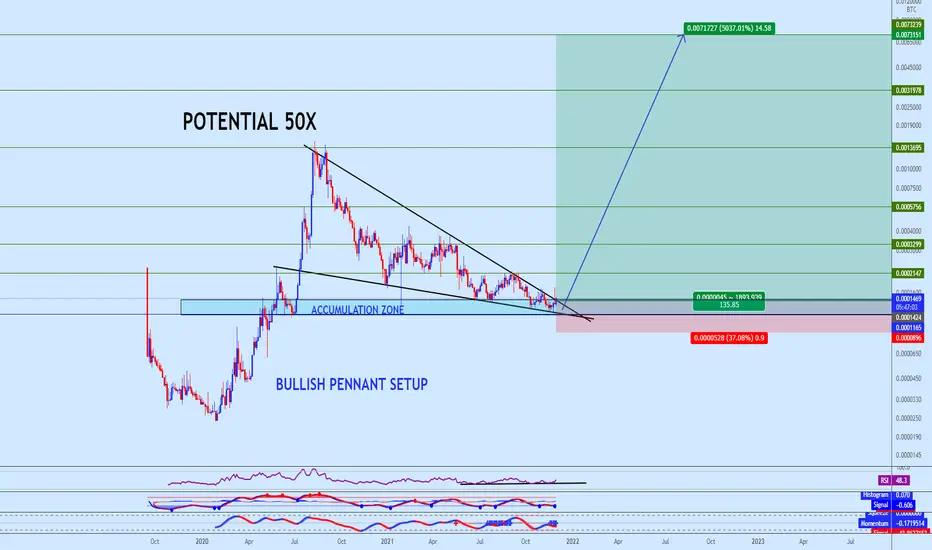
BandBtc with 50x potentialsSpotted Bullish Pennant with strong bullish divergence.
Make sure to follow the suggested BUY zone on the chart and always respect the given stop level.
I would appreciate your support by dropping your likes on my posts and follow us for more important market updates.
Thank you
One breakout please, BANDBTC?BANDBTC has been in a downward trend for more than a year. On the daily this looks like a huge bull flag and there were already a couple of attempts to breakout to the upside in the recent weeks.
It is a good time to watch BANDBTC in my opinion: If it holds above ~1040 we may see a big push to the upside with a lot of potential (~61x).
The volume has been declining and is quite thin since a couple of month. So basically waiting for that breakout with respective volume as confirmation.
The targets are on the chart. I would set the stop loss to <= 950.

Band Long- Elliot Waves and Charts PatternsIn the bigger picture, we can see a perfect Elliot waves count, we have a perfect (i-v) impulse, after that we have an a-b-c correction, that seems to be ending.
With this correction, the price made a massive descending wedge, it did not play that well, but the break down could be a false one. Moreover, a few months ago it started formed an descending channel the could be the key of an upside break and the starting of the third (III) wave.
The target of third wave is in the green box, of course this is in long term.
In the short term this could play very bad, with btc being so unstable, we could have a bigger drop, but in the long term this setup is bull quite bull.
If you are not familiar with Band protocol: "Band Protocol is a cross-chain data oracle platform that aggregates and connects real-world data and APIs to smart contracts". This is basically the fuel of smart contracts.

Now or neverRSI is currently at the bottom; Chaikin money flow is at the top.
The strong RSI trend will force a breakout of CMF (btc moving into the project).
Retest -> boom -> price discovery
Osmosis listing Band too!

Major reversal momentThe rest of the month should be very bullish.
RSI has hit the trend bottom
Stoch RSI has hit a trend bottom and ready to break out
Price is currently trading 36% under the all-time VWAP
Cloud is slightly bullish
Supertrend is bullish
A major fib time zone level was hit

bandbtc falling wedge breakoutbandbtc forming falling wedge pattern for a long time and now it's already breakout let's see what's gonna happen

BAND - Falling Wedge !BAND broke the falling wedge on crucial support and we can expect it to grow in BTC pair in the coming weeks. You can buy it partially for mid-term hold.
Stop-loss can be set under the support zone.

band/btc 1000%Band is breaking out of a 17 month downtrend.
close above 1275 sats and we will see a x10?
#band/btc


$BAND/BTC 3D (Binance Spot) Big falling wedge near breakout Band Protocol is starting to show some reversal signs, next impulse should be enough to regain 50MA support!
Current Price= 0.0001362
Buy Entry= 0.0001368 - 0.0001164
Take Profit= 0.0002209 | 0.0003189 | 0.0004976
Stop Loss= 0.0000889
Risk/Reward= 1:2.5 | 1:5.1 | 1:9.84
Expected Profit= +74.49% | +151.90% | +293.05%
Possible Loss= -29.78%
Fib. Retracement= 0.236 | 0.382 | 0.559
Margin Leverage= 1x
Estimated Gain-time= 8 months
Website: bandprotocol.com

Do something or dieThe band can you please do something here, its too much downtrend
Band to watch
need to break this trendline to find a setup
I'm not in it, just watching this coin.

BAND BTC BAND has been Accumulating for more than one year Price Explosion is at the door knocking waiting for a door to open


BAND vs Bitcoin Chart Analysis (BANDBTC #5)BANDBTC is showing some recent bullish action but with really weak volume... There is hope.
If we look at the last four candles, they are all green but the volume is not very convincing... It feels weak.
This is a short-term analysis as we are only looking from June forward.
BANDBTC is trading near All-Time Lows, in fact, the lowest ever was a long-wick back in January so this is ATL based on candle close.
All-Time Lows are really good for our trading style.
Setting up a trade at these levels can result in very low risk and high potential rewards.
That is, a tight stop-loss (around 0.00001243 in this case) paired with high targets...
But how you trade is up to you, we use manual stop-loss just so you know.
The MACD is showing a bullish cross while the histogram is green but it sits below zero, still.
The RSI is also trending higher but not yet in the bullish zone.
It would be perfect to see the RSI above 50, the MACD above zero, and BANDBTC above EMA50 or 0.00001592.
This is would give us very strong signals but there is still hope.
We have a strong bullish divergence with the MACD.
This isn't enough to consider this pair bullish but looking at the other altcoins, taking the whole market into consideration, then this one also can turn into a win.
Namaste.


BAND/BTC hello dear traders
2 level for buy band and hold it
see this price action
levels can support

Bullish Shark pattern on BandBtc & BandUsdtAccording to BTC it maybe go a bit lower,
I suggest to start to trade at first red line. Than Up move chance will be higher.

