2x Potential of TEVA. Possible Buying AreasIt looks like it has a possible 2x potential, I think the chart is pretty good. Around 15.25 as a buying place and if it comes, the 13.5-14 area looks good. If it goes directly from 15 or from here, it can be bought when it breaks and tests 18.5.
When we look at the chart from further back, we
Next report date
≈
May 7
Report period
Q1 2025
EPS estimate
0.49 USD
Revenue estimate
3.98 B USD
−1.45 USD
−1.64 B USD
16.51 B USD
1.15 B
About TEVA
Sector
Industry
CEO
Richard Francis
Website
Headquarters
Tel Aviv
Founded
1901
FIGI
BBG000C0CD58
Teva Pharmaceutical Industries Ltd. engages in the development, production, and sale of medicines. It operates through the following geographical segments: United States, Europe, and International Markets. The United States segment focuses on therapeutic area of central nervous system (CNS) portfolio, and is involved in the distribution business of generic, biosimilar and medicines, and over-the-counter (OTC) pharmaceutical products from the firm and third-party manufacturers to independent retail pharmacies, pharmacy retail chains, hospitals, and physician offices in the United States. The Europe segment offers OTC portfolio including SUDOCREM, NasenDuo, DICLOX FORTE, OLFEN Max, and FLEGAMINA brands in European Union, the United Kingdom, and certain other European countries. The International Markets segment provides its products to countries such as Canada, Israel, Russia, Latin America, and Japan. The company was founded in 1901 and is headquartered in Tel Aviv, Israel.
−22%
−11%
0%
11%
22%
Q4 '23
Q1 '24
Q2 '24
Q3 '24
Q4 '24
−1.50 B
0.00
1.50 B
3.00 B
4.50 B
Revenue
Net income
Net margin %
Revenue
COGS
Gross profit
Op expenses
Op income
Non-Op income/ expenses
Taxes & Other
Net income
−1.50 B
0.00
1.50 B
3.00 B
4.50 B
Revenue
COGS
Gross profit
Expenses & adjustments
Net income
−1.50 B
0.00
1.50 B
3.00 B
4.50 B
Q4 '23
Q1 '24
Q2 '24
Q3 '24
Q4 '24
0.00
5.50 B
11.00 B
16.50 B
22.00 B
Debt
Free cash flow
Cash & equivalents
No news here
Looks like there's nothing to report right now

TEVA to $20My trading plan is very simple.
I buy or sell when price tags the top or bottom of parallel channels.
I confirm when price hits Fibonacci levels.
So...
Here's why I'm picking this symbol to do the thing.
Price in channel zones at bottom of channels (period 100 52 & 26)
Stochastic Momentum Ind

Can Duvakitug Redefine IBD Therapy?Teva Pharmaceuticals, in a groundbreaking collaboration with Sanofi, has unveiled results from the Phase 2b RELIEVE UCCD study that could potentially reshape the landscape of inflammatory bowel disease (IBD) treatment. The study's focus, duvakitug, a novel anti-TL1A monoclonal antibody, has shown re

Setup: TEVATEVA : I have a swing trade setup signal. I'm looking to enter long if the stock can manage to CLOSE above the last candle high(BUY). If triggered, I will then place a stop-loss below (SL) and a price target above it(TP= Sell all or 50% & move SL to breakeven), then using the close below the 10SMA a


TEVA Pharmaceutical is a BUY?As the excitement around AI continues to wane, concerns about a potential US recession grow, and the risks of a major conflict in the Middle East linger, Teva Pharmaceutical's stock is entering an accumulation phase above $18, signaling strong bullish sentiment.
Why Wall Street's bullish in this d

Can a Pharmaceutical Giant Rewrite Its Own Destiny?In the complex world of global pharmaceuticals, Teva Pharmaceutical Industries Ltd. emerges as a compelling narrative of strategic reinvention. Under the leadership of CEO Richard Francis, the company has transformed from a struggling enterprise to a potential market leader, executing a bold "Pivot

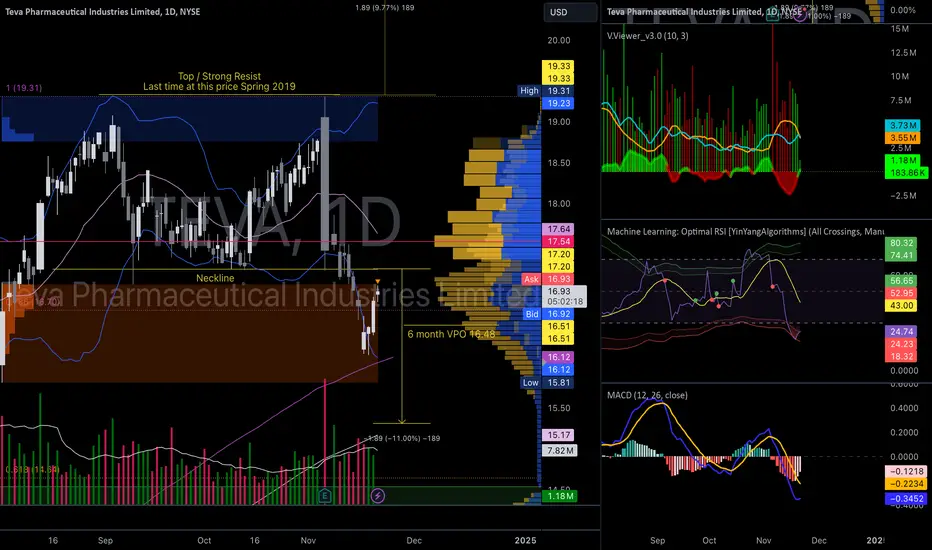
TEVA Moving Up?I've ben watching this for several days.
Most analyst are bullish except one thats bearish and has it listed as a short sale candidate. It was breaking down below the neckline but has reversed and trying to move back up towards the VPO.
Currently holding Calls with a strike of 17 and 19. Option a

New Setup: TEVATEVA: I have a green setup signal(dot Indictor). It has an excellent risk-to-reward ratio(RR:). I'm looking to enter long near the close of the day if the stock can manage to CLOSE above the last candle highs(white line). If triggered, I will then place a stop-loss below(SL) and a price target above

See all ideas
Summarizing what the indicators are suggesting.
Neutral
SellBuy
Strong sellStrong buy
Strong sellSellNeutralBuyStrong buy
Neutral
SellBuy
Strong sellStrong buy
Strong sellSellNeutralBuyStrong buy
Neutral
SellBuy
Strong sellStrong buy
Strong sellSellNeutralBuyStrong buy
An aggregate view of professional's ratings.
Neutral
SellBuy
Strong sellStrong buy
Strong sellSellNeutralBuyStrong buy
Neutral
SellBuy
Strong sellStrong buy
Strong sellSellNeutralBuyStrong buy
Neutral
SellBuy
Strong sellStrong buy
Strong sellSellNeutralBuyStrong buy
Displays a symbol's price movements over previous years to identify recurring trends.
TEVA.GJ
Teva Pharmaceutical Finance Co. LLC 0.25% 01-FEB-2026Yield to maturity
7.69%
Maturity date
Feb 1, 2026
TFAC
TEVA P.FI.NL III 16/46Yield to maturity
7.38%
Maturity date
Oct 1, 2046
TEVA4608603
Teva Pharmaceutical Finance Netherlands III BV 6.75% 01-MAR-2028Yield to maturity
6.96%
Maturity date
Mar 1, 2028
US88163VAD1
TEVA PHARM.FIN. 2036Yield to maturity
6.15%
Maturity date
Feb 1, 2036
TEVA5295245
Teva Pharmaceutical Finance Netherlands III BV 5.125% 09-MAY-2029Yield to maturity
5.65%
Maturity date
May 9, 2029
TFAB
TEVA P.FI.NL III 16/26Yield to maturity
5.64%
Maturity date
Oct 1, 2026
TEVA5295244
Teva Pharmaceutical Finance Netherlands III BV 4.75% 09-MAY-2027Yield to maturity
5.53%
Maturity date
May 9, 2027
TEVA5549924
Teva Pharmaceutical Finance Netherlands III BV 8.125% 15-SEP-2031Yield to maturity
5.46%
Maturity date
Sep 15, 2031
TEVA4608604
Teva Pharmaceutical Finance Netherlands III BV 6.75% 01-MAR-2028Yield to maturity
5.46%
Maturity date
Mar 1, 2028
TEVA5549923
Teva Pharmaceutical Finance Netherlands III BV 7.875% 15-SEP-2029Yield to maturity
5.44%
Maturity date
Sep 15, 2029
XS259280419
TEV.P.F.N.II 23/31Yield to maturity
4.25%
Maturity date
Sep 15, 2031
See all TEVA bonds