AAPL: Key Levels to Watch for Price DevelopmentAAPL: Key Levels to Watch for Price Development
Apple's stock (AAPL) has been range-bound between $193 and $212.50 for the past two months, repeatedly testing support near $193 on three occasions.
Each time, the price has rebounded strongly, pushing back toward $212.50—the upper boundary of this trading range.
Given this pattern, the likelihood of another move toward $212.50 remains high.
If AAPL successfully breaches $212.50, it could signal a larger bullish breakout, with upside targets at $224.50 and $240, as highlighted in the chart.
You may find more details in the chart!
Thank you and Good Luck!
❤️PS: Please support with a like or comment if you find this analysis useful for your trading day❤️
AAPLD trade ideas

AaplSimple trade..
The moving averages shown on the chart are the 20/50 ma.. if aapl closes above 206 then long aapl back to 213.00
If aapl drops below 200.00 then short price back to 193 gap close..
7$ move either way..
Aapl overall trend is neutral .
I do not think aapl will break above weekly 20sma at 215.00 if it does pump.
215 would be a great area to Reload for a short back down
Weekly chart.

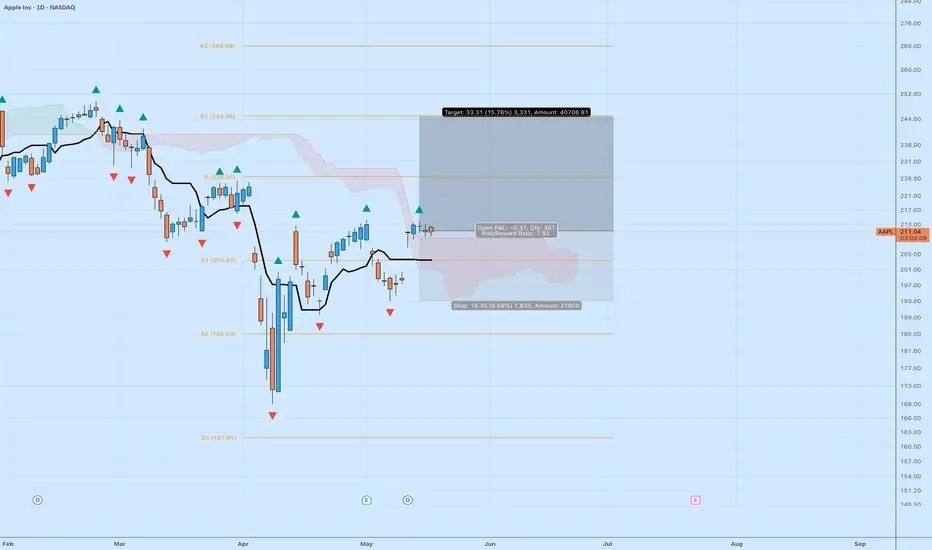
AAPL Long Trade Setup – 15.7% Upside PotentialApple (AAPL) just printed a clean breakout from consolidation, setting up a favorable long opportunity.
🔍 Trade Details:
Entry: ~$210.97
Target: $244.28 (+15.76%)
Stop: $192.12 (-6.86%)
Risk/Reward: 2.2R
Volume: Holding strong
Ichimoku: Price pushing above the cloud with bullish sentiment building
🔧 Why it matters:
Price reclaimed the pivot zone and is hovering above key support
Clean upside to R1 resistance with minimal overhead supply
Broader market strength + earnings season could provide the catalyst
📊 Strategy:
Holding above $205 keeps this trade intact. Watch for confirmation on the next daily close. Could see momentum pick up fast if tech leads.
Are you riding this one up? Drop your AAPL thoughts below 👇
#AAPL #TradingView #LongSetup #Ichimoku #TechStocks #SwingTrade #RiskReward
APPLE LONG IDEAAPPLE has been going up for a while. From a weekly timeframe, price is coming from a valid demand zone in the discount level. This implies that the target is the swing high created by the last structure. However, price will not just move straight to the high. Thus, the continuation pattern for a buy opportunity. This is also supported by the bullish divergence signal from the awesome oscillator.
On the daily timeframe, price has formed double bottom and it has broken out of a down trend line and Fibonacci level at 0.618. If the current daily bullish candle should close above the trend line, this will serve as a strong signal for going long. An aggressive trader or investor may enter a long position after the closure of the daily candle. While a conservative trader or investor may wait for price to drop to $200.19 at 0.618 Fibonacci level. First target is $212 while the final target is around $260, more than 27% growth from the entry. While the stop can be around $192.40.
Confluences for the long idea:
1. Price is in discount level.
2. There's a bullish divergence signal from awesome oscillator.
3. There's a double bottom chart pattern on daily timeframe.
4. Price has broken out of down trend line and 0.618 Fibonacci level.
5. The market structure is bullish.
Are you in need of a technical stock analyst, signal provider, or professional trainer for a one-on-one technical analysis training, you can book an appointment here: calendly.com
Disclaimer: This is not a financial advice. The outcome maybe different from the projection. If you can't accept the risk, don't take the signal.

GLD Swing Setup – Long Call Into Gold’s Weekly Strength🪙 GLD Swing Setup – Long Call Into Gold’s Weekly Strength
📆 Date: June 6, 2025
📈 Outlook: Moderately Bullish (14-day swing)
📊 Strategy: Long call aiming for continuation above key resistance
🔍 Model Consensus
Model Bias Strike Entry Target(s) Stop Confidence
Grok Mod. Bullish 311C 3.90 5.07 1.95 70%
Claude Mod. Bullish 312C 3.40 5.10 / 6.80 2.04 70%
Llama Mod. Bullish 320C 1.19 1.75 / 2.38 0.60 75%
Gemini Mod. Bullish 320C 1.20 1.75 / 2.35 0.60 75%
DeepSeek Mod. Bearish 308P 3.60 1.80 (fade) 5.40 60%
✅ Majority Bias: Bullish
💡 Preferred Strike: $320 Call (3:1 model preference)
📈 Chart Levels:
Support: $301.50 – $303.00
Resistance: $310.25 – $311.67 → breakout zone
Max Pain: $308 (gravitational pull zone short-term)
⚙️ Technical Summary
Daily/Weekly Charts: Price above mid BB, above EMAs, MACD trending positive
RSI: Neutral-to-bullish (daily ~56, weekly ~66)
VIX: Low = stable sentiment & slower decay
News: Bullish gold flow / macro sentiment steady
OI Skew: Heavy 297–299 puts, but aggressive calls up to $320 → breakout pressure
✅ Trade Setup
Metric Value
Instrument GLD
Direction CALL (Long)
Strike $320
Expiry 2025-06-18
Entry Price $1.19 (ask)
Profit Targets $1.75 / $2.35
Stop-Loss $0.60 (50% risk)
Position Size 1 contract
Confidence 75%
Entry Timing Market Open
📈 Trade Management Plan
🎯 Targets
Scale out 50% at $1.75
Final exit at $2.35
🛑 Stop Triggers
Break below $307.50 support
Premium drops to $0.60
📆 Hold Time
Max 10 trading days
Exit early if price stagnates near $308
⚠️ Key Risks
Triple-top near $310.25 could stall breakout
Low VIX reduces premiums faster in chop
Gold news or dollar spikes can flip the narrative fast
Max Pain at $308 could cap rallies short-term


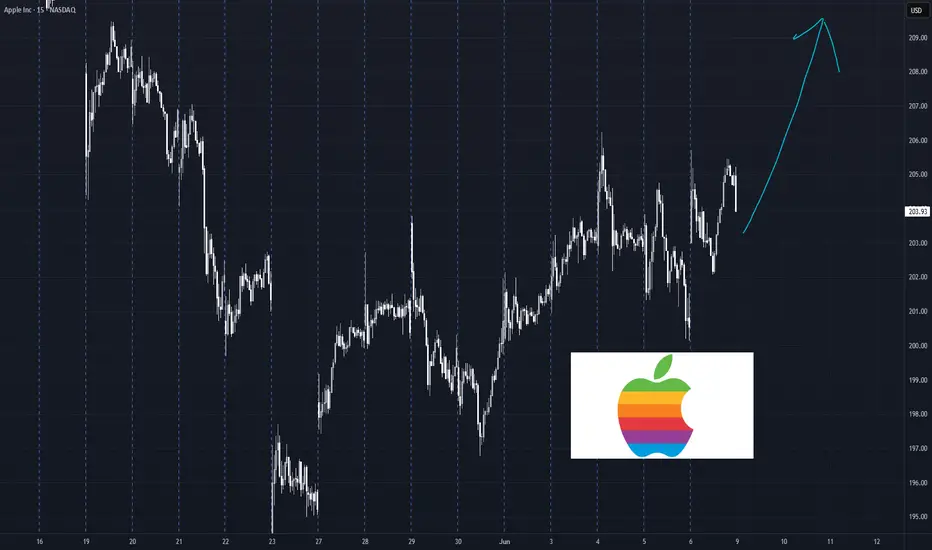
Apple (AAPL) Shares Consolidate Ahead of WWDCApple (AAPL) Shares Consolidate Ahead of WWDC
Today, 9 June, marks the start of Apple’s Worldwide Developers Conference (WWDC) — an event that traditionally attracts significant attention from investors and traders.
It is fair to say that WWDC 2025 begins against a rather negative backdrop:
→ Since the start of 2025, AAPL stock price has fallen by 19%, and Apple has lost its title as the world’s most valuable company, now trailing behind Microsoft and Nvidia.
→ Expectations raised by last year’s conference — particularly regarding new AI features in the iPhone — were not fully realised. As Barron’s noted, in March, an Apple spokesperson admitted that the new Siri “will take longer than we thought to implement these features. We expect to roll them out next year.”
Technical Analysis of the AAPL Chart
AAPL price movements are forming a narrowing triangle pattern:
→ The red trendline highlights sustained downward pressure on AAPL shares in 2025 — partly driven by concerns over the impact of the ongoing trade war;
→ On the other hand, the area below the psychological $200 level may attract buyers willing to take on risk.
WWDC 2025 could well provide fresh hope for the bulls and prompt an attempt to break out upwards from the triangle pattern.
This article represents the opinion of the Companies operating under the FXOpen brand only. It is not to be construed as an offer, solicitation, or recommendation with respect to products and services provided by the Companies operating under the FXOpen brand, nor is it to be considered financial advice.


The key is whether it can rise above 209.27
Hello, traders.
If you "Follow", you can always get new information quickly.
Have a nice day today.
-------------------------------------
(AAPL 1D chart)
In order to continue the uptrend in the medium to long term, the price needs to stay above the M-Signal indicator on the 1M chart.
The important support and resistance zones at the current price position are the 182.94-199.62 zone and the 226.67-240.55 zone.
In that sense, the key is whether it can support near the 182.94-199.62 zone and rise above 209.27 to maintain the price.
The 226.67-240.55 zone is expected to act as resistance, but if it breaks through upward, it is expected to renew the ATH.
The important support zone is the 131.59-138.79 zone. If it falls to this area and shows support as the trading volume increases, you should focus on finding a buying point.
-
The basic trading strategy is to buy on the HA-Low indicator and sell on the HA-High indicator.
This trading strategy is a trading method within the box range.
If it falls below the HA-Low indicator or rises above the HA-High indicator, you should create a trading strategy using the trend trading method.
Therefore, the basic trading method should be a split trading method.
The 215.44 point is the OBV Low indicator point on the 12M chart, and from a long-term perspective, it can be interpreted that an uptrend can begin only when it rises above 215.44.
Therefore, you can see that the 209.27-215.44 section is an important section for turning into an uptrend.
-
Thank you for reading to the end.
I hope you have a successful trade.
--------------------------------------------------

Apple next possible moveHi traders as you can the structure is already shift from temporary pull back n is gaining momentum to the upside soo you make sure you position yourselfs,using this set up don't fall for short moves while you trading stocks if you entered hold until given targets,I won't explain much but,you are in the right hands n right directions we are going to win,trust the process n believe in bigger time frame it Will change your trading career forever and you won't stay in the chart the whole day but buying n forget😊 all the stress of short moves will disappear and you gonna start to win more than you loose, all the best my friends listening is a skill.

AAPL Swing Trade Plan – 2025-06-06🍏 AAPL Swing Trade Plan – 2025-06-06
Bias: Moderately Bullish
Timeframe: 5–10 days
Catalyst: WWDC event, bullish short-term technicals, declining VIX
Trade Type: OTM call option with high R/R profile
🧠 Model Consensus Snapshot
Model Direction Strike Entry Price Profit Targets Stop Loss Confidence
Grok No Trade – – – – 50%
Claude Long $207.50 ~$2.04 $3.00 / $3.75 ~$1.40 72%
Llama Long $205.00 ~$2.87 +20% -50% 78%
Gemini Long $210.00 ~$1.45 $2.10 / $2.90 ~$0.72 75%
DeepSeek Long $215.00 $0.70 $1.05 / $1.40 $0.35 75%
✅ Majority View: Moderately Bullish
📉 Max Pain: $205 → Possible short-term magnet
📆 WWDC Event: Potential catalyst or risk depending on outcome
🧾 Sentiment: Positive, with a bullish skew on options OI
📈 Technical Overview
Short-term: Above 10-EMA on 15m and daily
Medium-term: Challenging 50-EMA (~$204.83)
Weekly: Mixed but improving MACD
VIX: Falling (<20), supportive of calls
Risk: Compression near $205 due to max pain, and event risk from WWDC
✅ Final Trade Setup
Parameter Value
Instrument AAPL
Direction CALL (LONG)
Strike 215.00
Expiry 2025-06-20
Entry Price $0.70
Profit Targets $1.05 (50%) / $1.40 (100%)
Stop Loss $0.35 (50%) or if AAPL closes < $203.33
Size 1 contract
Entry Timing At market open
Confidence 75%
📍 Rationale: Deep OTM offers low-cost exposure with strong potential R/R into an event week.
⚠️ Key Risks to Watch
Break below $203.33 → invalidate bullish thesis
WWDC disappointment → negative gamma risk
Max pain at $205 → short-term pinning risk
Theta decay → rapid loss if no momentum by mid-week
AAPL CallsHypophysis: AAPL has been trending in a wedge pattern on the weekly and daily time frame since mid-April. I am considering a monthly or weekly call option.
Additional arguments: I am thinking Long because of the yearly trend on AAPL, the Tariff pausing, and the large "buy of the dip" that happened in the first week of April.
Conditions: I need more data points on the daily timeframe to see how the price action reacts towards the tip of the wedge. I plan to re-evaluate my entry/exit points for the long call position around WED-Fri (5/11-5/13).
Conclusion: If anyone wants to chime in here and maybe share how option prices would potentially increase closer to the wedge tip, that would be great! I would only consider an early entry if option prices would be a bargain at an early entry point, but this would sacrifice confirmation by having a looser trade plan.

Could AAPL Breakout Soon...Symmetrical Triangle Setup...Pre-WWDCAAPL is forming a symmetrical triangle on the 4H chart, setting up for a potential breakout. This neutral pattern, with converging trendlines, signals consolidation before a big move. The upper trendline (resistance) is near $207, and the lower trendline (support) is around $200, with the current price at $205. RSI is neutral at 50, and volume is decreasing—classic signs of an imminent breakout.
Fundamental Catalyst: WWDC next week could be a game-changer, with potential AI updates (think “Apple Intelligence” enhancements). Positive news could fuel a bullish breakout, while a “sell the news” reaction might trigger a downside move.

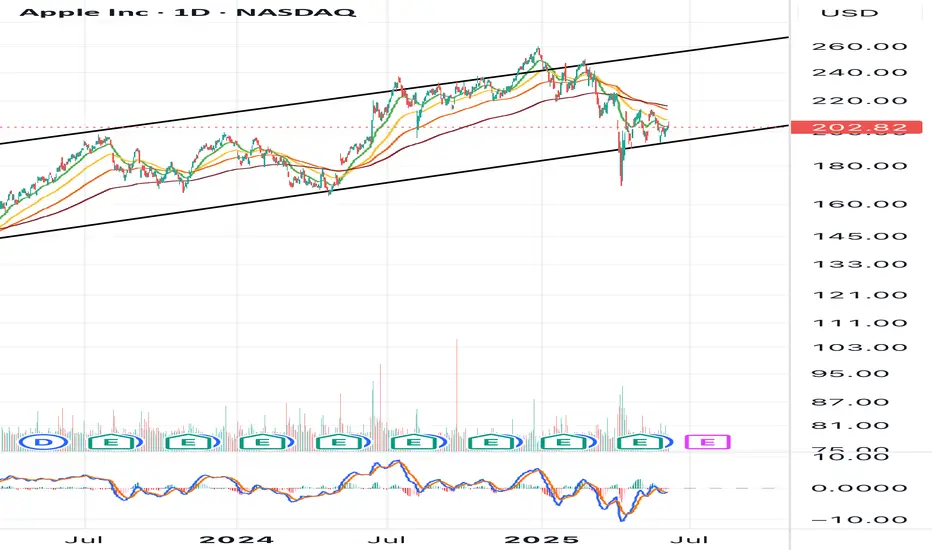
AAPL Ascending Price ChannelAAPL has been in ascending price channel since August 2020. At the start of April we saw a retest of support where it temporarily broke through, tested the 200 ema, bounced, then broke back above the previous support line. Since then it has retested support 3 separate times which is a strong indication that AAPL will continue to remain in this price channel for the foreseeable future.
AAPL for me an obvious short term long entryThis would be a Swing trade, which I would personally trade because it is a common pattern, not a chart pattern, but a Price Action Pattern. To explain it quickly. First you get a sell off, then stopping Volume with Buy limit orders pushing the stop up, then you see Volume dropping, and after that some more Volatile price action. But I generally dont do these kinds of trades, because I like to have more safety and when I´m short term invested I have more risk and this is not coping with my personal risk - reward policy.


5 stocks that shook the market in MayMay 2025 turned out to be a landmark month for the U.S. stock market. Several top companies posted impressive gains driven by explosive demand for AI technologies, advancements in autonomous transport, and strong corporate strategy.
Here are the five market leaders that set the tone in May:
1. Nvidia – The AI Powerhouse
Nvidia (#NVIDIA) surged 25% in May, becoming the most valuable U.S. company with a market cap of $3.45 trillion — surpassing even Microsoft. The rally was fueled by stunning data center results, with revenue hitting $39.1 billion (+427% YoY). Its new Blackwell chip series has already sparked massive interest from leading AI developers. UBS analysts raised their price target to $175, predicting further growth in high-performance computing.
2. Apple – A return to growth
Apple (#Apple) saw a solid 7% gain, rebounding from earlier struggles. The company announced $500 billion in long-term investments over the next five years to create new jobs and manufacture AI servers in the U.S. This move restored investor confidence and supported the stock’s recovery.
3. Tesla – Robotaxis drive momentum
Tesla (#Tesla) jumped 25%, boosted by the announcement of its robotaxi launch in Austin, Texas, scheduled for June 12. Combined with improving market conditions and a pause in EU tariff pressure, Tesla shares reclaimed center stage. Wedbush analysts see potential for the stock to hit $500 as the company expands its autonomous and AI-driven initiatives.
4. Moderna – Biotech breakthroughs
Moderna (#Moderna) gained 7% following positive results from new cancer drug trials. The company also revealed plans to cut operational costs by $1.7 billion by 2027, aiming to boost overall efficiency. Investors welcomed the strategic pivot beyond COVID-related products.
5. Alcoa – Aluminum and geopolitics
Alcoa (#Alcoa) rose 6.5% on reports that the U.S. may ban aluminum imports from Russia. This geopolitical development, along with steady dividends and renewed investor interest in commodities, positioned Alcoa as a top-performing metals stock for the month.
May 2025 confirmed the market’s focus on AI, autonomous transport, biotech, and raw materials. Nvidia, Tesla, Apple, Moderna, and Alcoa led the charge — and FreshForex analysts recommend riding this momentum for active trading on high-performing stocks.

AAPL Bounce at 200 EMA- Remains in ascending channelAAPL has been in ascending price channel since August 2020. At the end of April we saw a retest of support where it temporarily broke through, tested the 200 ema, bounced, then broke back above the previous support line. I believe AAPL will remain in this channel and price will continue to rise with an eventual retest of resistance.


AAPL Weekly Options Outlook — June 3, 2025📈 AAPL Weekly Options Outlook — June 3, 2025
🚨 AI Model Consensus: Moderately Bullish into June 6 Expiry
🧠 Model Summary
🔹 Grok (xAI)
Bias: Moderately Bullish
Setup: Price above EMAs, MACD divergence softening; resistance at $203.40
Trade: Buy $207.50C @ $0.67 → PT $1.00, SL if AAPL < $202
Confidence: 65%
🔹 Claude (Anthropic)
Bias: Moderately Bullish
Setup: Bullish reversal, rising EMAs, MACD improving
Trade: Buy $207.50C @ $0.67 → PT $1.20–$1.80, SL $0.35
Confidence: 70%
🔹 Gemini (Google)
Bias: Moderately Bullish
Setup: Above EMAs, MACD histogram rising; resistance $203.46–$203.81
Trade: Buy $207.50C @ ~$0.65 → PT $0.97–$1.14, SL $0.32
Confidence: 65%
🔹 Llama (Meta)
Bias: Moderately Bullish
Setup: Above EMAs, MACD crossover building
Trade: Buy $207.50C @ $0.67 → PT $0.80, SL $0.335
Confidence: 70%
🔹 DeepSeek
Bias: Moderately Bearish
Setup: MACD still negative; resistance at $203.81
Trade: Buy $200P @ $0.93 → PT $1.86, SL $0.46
Confidence: 65%
✅ Consensus Highlights
🔼 Bullish Momentum on short-term EMAs
📉 Max Pain at $200 could limit upside by Friday
📊 Strong liquidity on both $207.50C and $200P
🔁 Most models plan to exit midweek; only DeepSeek expects a breakdown
🎯 Recommended Trade Setup
💡 Strategy: Bullish Single-Leg Weekly Call
🔘 Ticker: AAPL
📈 Direction: CALL
🎯 Strike: $207.50
💵 Entry: $0.67 (ask)
🎯 Profit Target: $1.17 (+75%)
🛑 Stop Loss: $0.34 (−50%)
📏 Size: 1 contract
📅 Expiry: 2025-06-06
⏰ Entry Timing: Market Open
📈 Confidence: 68%
⚠️ Risk Factors
📉 Max pain gravity could limit upside later in the week
🔼 Resistance zone at $207.50–$210 may stall momentum
⌛ Rapid theta decay — needs early move to profit
📰 Any negative macro or tech headlines could invalidate setup

AAPL 2025 Strategic Outlook: Overview of Primary CatalystsAfter trading around $200 intraday on May 27, Apple shares closed at $200.21—up 2.5% despite broad market headwinds and lingering investor skepticism.
Technical outlook remains bullish, as price action is still defined by
a rising bullish channel on higher time frames. expecting AAPL to bottom
out heading into Q3/Q4 2025 and then another bull run of 70-80%.
Here are the primary catalysts shaping Apple’s stock price in 2025, ranked 0–10:
AI integration and Apple Intelligence
Strength: 9/10
Rollout of on-device AI features (upgraded Siri, generative image tools, ChatGPT integration) expected to drive a renewed iPhone upgrade cycle.
Services segment growth
Strength: 8.5/10
App Store, Apple Music, iCloud and other services projected to grow double-digits, with new AI services adding billions in revenue.
Gross margin expansion and cost efficiencies
Strength: 8/10
Shift toward higher-margin services and anticipated memory price declines could boost overall gross margin by roughly 50 basis points.
iPhone 17 product cycle
Strength: 7.5/10
Rumored polymer battery improvements and possible foldable models may spur meaningful hardware upgrades versus Android peers.
Vision Pro and hardware diversification
Strength: 7/10
Mixed-reality headset upgrades under Apple Intelligence will broaden appeal, though high price and modest enterprise traction limit near-term impact.
Share buybacks and dividend policy
Strength: 7/10
A planned $100 billion buyback in 2025, plus steady dividends, underpins valuation, though recent pullbacks hint at caution amid cost headwinds.
Supply-chain diversification and trade policies
Strength: 6.5/10
Ongoing U.S.-China tensions and potential tariffs create uncertainty; pivoting assembly to India and Vietnam helps mitigate risk.
Regulatory and antitrust pressures
Strength: 6/10
New EU rules may force Apple to open parts of its ecosystem, potentially weighing on Services revenues.
Macro and interest-rate environment
Strength: 5/10
A “higher-for-longer” Fed rate outlook raises discount rates on growth, tempering valuations for tech leaders.
Smartphone market competition
Strength: 5/10
Samsung and fast-growing Chinese OEMs intensify price and feature competition, especially in emerging markets.
⭐️Catalyst Strength Rankings (May 2025)
✅AI integration and Apple Intelligence: 9
✅Services segment growth: 8.5
✅Gross margin expansion and cost efficiencies: 8
✅iPhone 17 product cycle: 7.5
✅Vision Pro and hardware diversification: 7
✅Share buybacks and dividend policy: 7
✅Supply-chain and trade policy risk: 6.5
✅Regulatory and antitrust pressures: 6
✅Macro and Fed policy: 5
✅Smartphone competition: 5

Apple - Please look at this chart!Apple - NASDAQ:AAPL - is just wonderful:
(click chart above to see the in depth analysis👆🏻)
Last month, Apple created a quite strong bullish rejection wick of about +25%. It was actually no surprise at all, because market structure was perfectly pushing price higher. Following the bullish break and retest pattern, new all time highs will most likely follow.
Levels to watch: $200, $300
Keep your long term vision!
Philip (BasicTrading)

Apple Stock Analysis: A Potential Surge to $225 by June 9, 2025!At Vital Direction, we continuously analyse market trends to provide our clients with cutting-edge insights. Today, we’re focusing on Apple Inc. (AAPL), a stock that has been attracting significant attention from investors worldwide.
Current Analysis: The Bottom and the Upswing
Since the bottom of April 8, Apple stock has shown promising signs of recovery, bouncing back from the $169 level. This upward movement appears to be the initial phase of a larger trend. Our technical analysis suggests that this uptrend corresponds to an A wave in the Elliott Wave Theory.
Consolidation Phase: The ABCDE Triangle
Following this initial surge, Apple stock entered a consolidation period, which we interpret as a contracting triangle pattern—an ABCDE formation. This pattern indicates a period of indecision in the market, often preceding a significant price move. Our analysis indicates that the E wave of this triangle concluded around the $193.47 mark.
Future Outlook: Aiming for $225
As we look ahead, our projections for Apple stock are optimistic. We anticipate a potential rise to $225, provided the $193.47 level remains unbreached. This target is based on our technical analysis and market conditions. Our forecast suggests that this upward movement could materialise around June 9, 2025. However, it’s essential to remain vigilant, as broader market dynamics, particularly with the S&P 500, could influence Apple’s stock performance in the longer term.
Conclusion: A Great Risk-Reward Opportunity
In summary, Apple stock presents an exciting risk-reward opportunity. As long as the $193.47 support level holds, we expect significant upward movement towards the $225 mark by mid June 2025. Stay tuned to Vital Direction for more expert market insights and updates.
