AMAZON eyes $255 on the 3rd such buy signal in 18 months!AMAZON Inc. (AMZN) has been trading within a 18-month Bullish Megaphone pattern whose latest bottom was on the April 07 2025 Low. Since then, the pattern has started its new Bullish Leg, which has been confirmed by the break-out above its 1D MA50 (blue trend-line) and the 1W RSI's above its MA.
The
Key facts today
0.040 USD
52.62 B USD
566.64 B USD
About Amazon.com
Sector
Industry
CEO
Andrew R. Jassy
Website
Headquarters
Seattle
Founded
1994
ISIN
ARBCOM460176
Amazon.com, Inc. is a multinational technology company, which engages in the provision of online retail shopping services. It operates through the following segments: North America, International, and Amazon Web Services (AWS). The North America segment offers retail sale of consumer products, including from sellers, advertising, and subscriptions services through North America-focused online and physical stores. The International segment focuses on retail sale of consumer products, including from sellers, advertising, and subscription services through internationally-focused online stores. The AWS segment is composed of global sales of compute, storage, database, and other services for start-ups, enterprises, government agencies, and academic institutions. The company was founded by Jeffrey P. Bezos in July 1994 and is headquartered in Seattle, WA.
7.0%
8.1%
9.2%
10.3%
11.4%
Q1 '24
Q2 '24
Q3 '24
Q4 '24
Q1 '25
0.00
50.00 B
100.00 B
150.00 B
200.00 B
Revenue
Net income
Net margin %
Revenue
COGS
Gross profit
Op expenses
Op income
Non-Op income/ expenses
Taxes & Other
Net income
0.00
40.00 B
80.00 B
120.00 B
160.00 B
Revenue
COGS
Gross profit
Expenses & adjustments
Net income
0.00
40.00 B
80.00 B
120.00 B
160.00 B
No news here
Looks like there's nothing to report right now

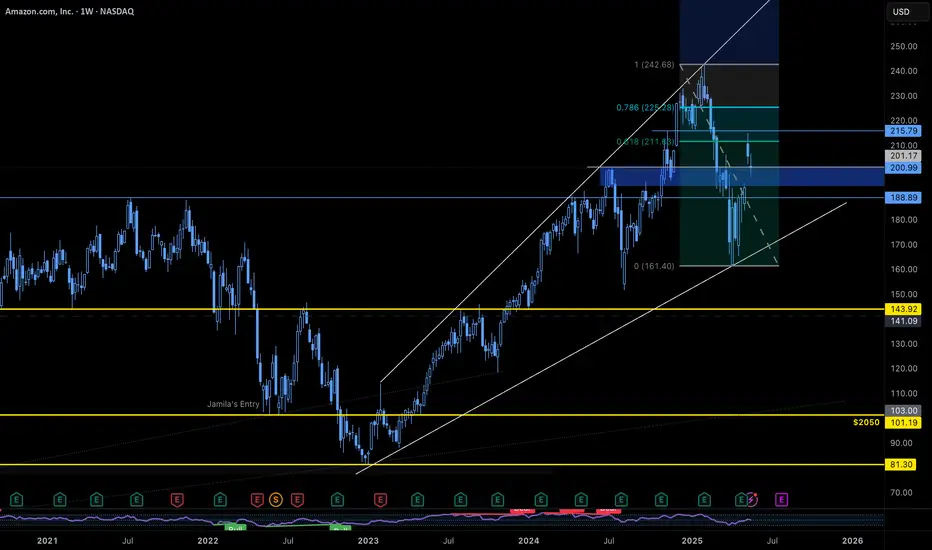
Amazon UpdatePrice has re-entered the target box. I mentioned last week that price could still try to target the 1.618 @ $220.01. Judging by the ES, I think it is highly likely that is what is going on. We're still currently trading on hidden bearish divergence which doesn't bode well for a sustained move higher

AMZN Stuck Between GEX Walls – Breakout or Breakdown Coming? 6/2🧠 GEX Daily Outlook (Options Sentiment Setup)
Amazon ( NASDAQ:AMZN ) closed around $205, sitting almost flat right below the HVL (High Volume Level) and the critical 202.5–208 gamma resistance cluster. This week's setup is tricky — you're right between big put support and call resistance.
GEX Flow

$AMZN Cracks Once AgainIt should be no surprise that after massive gains such as we have seen lately, stocks tend to retrace 60-70% or more back to the origin from whence they came.
This is largely due to the Market Maker "Making a Market" for everyone to play in, but mostly so they don't loose any money.
The Tech spa

AMZN BUYBUY AMZN at 182.00 to 173.00, riding it back up to 240.00 to 255.00 as Profit Targets, Stop Loss is at 161.00!
If anyone likes mumbo jumbo long useless analysis,
than this is NOT for you.
Also, if you are afraid of risk, failure, and want only a 100% sure thing, than...
run as fast as you can from

AMZN | Long | Strong Earnings Momentum | (May 28, 2025)AMZN | Long | Strong Earnings Momentum + Structural Breakout | (May 28, 2025)
1️⃣ Quick Recap: We're in a long trade on Amazon (AMZN), and the setup is unfolding well. TP1 and TP2 have already been hit after flipping key resistance into support. The trend is intact, and we're now aiming for higher

$AMZN Weekly Setup – Watch the $193 GapHere's what we're seeing on the weekly chart:
Price recently hit the 61.8% fib retracement from the all-time high to the April 2025 low
Sitting on strong support from the July 2024 high
A gap at $193 is just below current levels
If the gap closes and holds, we could see a continuation of th
$NVDA $TSLA $META $AMZN – Triangle Squeeze Incoming?📊 Symmetrical triangle formations are building across these tech giants — and volatility is compressing.
🔍 What to watch:
📈 Breakout above upper trendline = bullish momentum
📉 Breakdown below lower trendline = bearish confirmation
📉 RSI on NASDAQ:NVDA is at 73.04 = overbought warning
⚠️ NASD

Profit Raiders’ Guide to Conquering AMAZON Stock!Hello, Wealth Warriors! 🌟
Stock market adventurers, let’s embark on a thrilling quest to dominate AMAZON stock with our cunning Raider Trading Strategy! 🗡️📈 Fueled by razor-sharp technical analysis and robust fundamental insights, this plan targets high-reward zones while dodging market traps. Foll

Amazon should be closely look for resistanceAmzon has importance resistance to be break at 218.25 USD with closed candle above 218.25. if it not close over 218.25 after it test this resistance. it might have a chance for dropped by 10%++. However, if it closed above 218.25 and stay drop for time frame 240 min. this is a chance for long to tes

See all ideas
Summarizing what the indicators are suggesting.
Oscillators
Neutral
SellBuy
Strong sellStrong buy
Strong sellSellNeutralBuyStrong buy
Oscillators
Neutral
SellBuy
Strong sellStrong buy
Strong sellSellNeutralBuyStrong buy
Summary
Neutral
SellBuy
Strong sellStrong buy
Strong sellSellNeutralBuyStrong buy
Summary
Neutral
SellBuy
Strong sellStrong buy
Strong sellSellNeutralBuyStrong buy
Summary
Neutral
SellBuy
Strong sellStrong buy
Strong sellSellNeutralBuyStrong buy
Moving Averages
Neutral
SellBuy
Strong sellStrong buy
Strong sellSellNeutralBuyStrong buy
Moving Averages
Neutral
SellBuy
Strong sellStrong buy
Strong sellSellNeutralBuyStrong buy
Displays a symbol's price movements over previous years to identify recurring trends.
US23135BT2
AMAZON.COM 20/50Yield to maturity
6.99%
Maturity date
Jun 3, 2050
AMZN4996701
Amazon.com, Inc. 2.7% 03-JUN-2060Yield to maturity
6.97%
Maturity date
Jun 3, 2060
US23135CC8
AMAZON.COM 21/61Yield to maturity
6.64%
Maturity date
May 12, 2061
AMZN5182959
Amazon.com, Inc. 3.1% 12-MAY-2051Yield to maturity
6.56%
Maturity date
May 12, 2051
AMZN5182958
Amazon.com, Inc. 2.875% 12-MAY-2041Yield to maturity
6.16%
Maturity date
May 12, 2041
US23135CJ3
AMAZON.COM 22/52Yield to maturity
6.13%
Maturity date
Apr 13, 2052
US23135CK0
AMAZON.COM 22/62Yield to maturity
6.13%
Maturity date
Apr 13, 2062
AMZN4531868
Amazon.com, Inc. 4.25% 22-AUG-2057Yield to maturity
5.98%
Maturity date
Aug 22, 2057
AMZN4531866
Amazon.com, Inc. 4.05% 22-AUG-2047Yield to maturity
5.98%
Maturity date
Aug 22, 2047
US23135AQ9
AMAZON.COM 14/44Yield to maturity
5.46%
Maturity date
Dec 5, 2044
See all AMZND bonds
Curated watchlists where AMZND is featured.


