BCS trade ideas
BARCLAYS BULLISH MARKETBearish channel on weekly chart with time to reach the top.
Bearish guideline close to breaking, which would confirm the main bullish momentum.
The price makes a small correction to 50%, where it forms a follow-up pattern, which breaks its respective resistance, giving us a projection up to 185.
If the price breaks above the 78 fibo level, it could go looking for the 193 high.
ENJOY! :)
BCS - Long - Upward Trend ContinuationBarclays
Break then retest 8.98 / 9.44-new support levels
PT Range 9.91 - 10.40
Barclays operates as a bank holding company that engages in the business of providing retail banking, credit cards, corporate and investment banking and wealth management services. The company operates through two divisions: Barclays UK and Barclays International. The Barclays UK division comprises the U.K. retail banking operations, U.K. consumer credit card business, U.K. wealth management business and corporate banking for smaller businesses. The Barclays International division comprises the corporate banking franchise, the investment bank, the U.S. and international cards business and international wealth management. Barclays was founded on July 20, 1896 and is headquartered in London, the United Kingdom.
Barclays Bank BuyAn interesting chart of Barclays bank where the downtrend has been broken
plus the correction was stopped by now acting support.
This is a bullish development and ideal long entry...this is at odds with the bearish
herd and suggests something else is coming.
A stop back into the channel is your protection.
Good trading
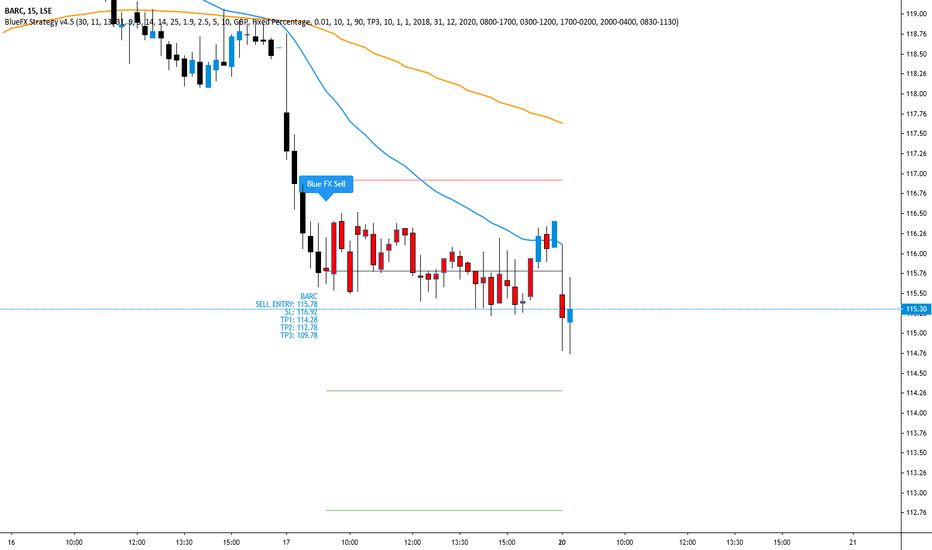
BARCLAYS CLOSED +1.7% GAIN! SELLS NOW VALID TO ENTER!!JUMP IN THEM SELLS TEAM! BARCALYS NOW VALID TO ENTER FOR A SELL!
Stocks strategy file now released! below youll see our list of stocks we have found optimal settings for!
Amazon
Apple
Tesla
Cineworld
Facebook
Netflix
BABA
US30
DAX - DE30EUR
US500
NAS100
SPX500USD
Google
ROKU
UK100
BA - Boeing
Zoom ZM
Barclays
What is our strategy?
Our strategy is a trend following strategy - that is coded in pine script to use with the trading view platform - the entries are shown automatically! NOTHING is done manually, it can be used on any instrument and time frame. However, we have hard coded specific parameters for when trading the H1 time frame, so we can back up over 4200 previous trades to confirm our edge from previous data. This gives us confidence in execution and belief in our trading strategy for the long term.
The strategy simply sits in your trading view, so you will see exactly what we see - the trade, entry price, SL and multiple TPs (although we hold until opposite trade as this is the most profitable longer term plan), lot size, etc.
This could be on your phone trading view app, or laptop of course.
The hard work is done, so we have zero chart work time, no analysis, no time front of the chart doing technical analysis - technical analysis is very subjective - you may see different things at different times - how do you have a rigid trading plan on a H&S shoulder pattern? Your daily routine, diet, sleep, exercise can affect what you 'see' and your decision making, this doesn't happen when a strategy is coded like this; what we do have is a mechanical trading strategy...
What does this mean?
It means, we are very clear on our entry and our exit and use strict risk management (this is built in - put in your account size, set your risk in % or fixed amount and it will tell you what lot size to trade!) so we have no ego with our position and we are comfortable with all outcomes - its simply just another trade. This free's our mindset from worry and anxiety as we take confidence from knowing our edge is there and also that we have used sensible risk management.
The strategy itself can be used as a live trading journal too!
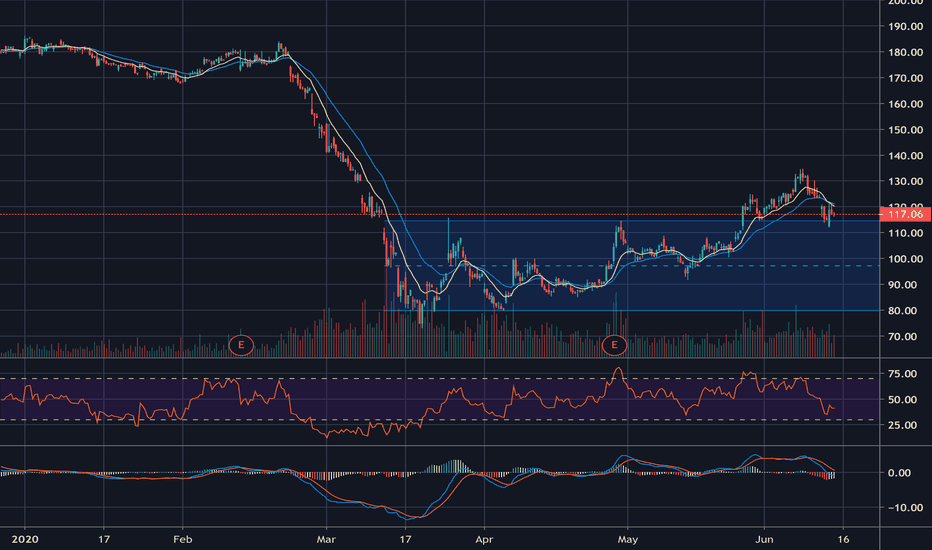
BARCLAYS JULY 2020 Technical AnalysisOne of the most challenging aspects of trading is to be patient and wait for your trade plan to materialise. I've been tracking the above set-up for Barclays since early June and the set-up is beginning to crystallise. I always think ABC before 12345, so with this in mind, I have Barclays putting in a B wave flat before a C wave to match the A wave, which would likely complete a larger A wave. We have to remember that the move down in March was a wave extension and complexity is likely to follow such a wave extension, therefore I am anticipating the upward correction to be choppy and time consuming, but with plenty of opportunity if the trades are managed correctly. Good luck if you're trading Barclays and it does look as though an opportunity could be around the corner.


