Anyone else seeing #RisingWedge on $HD? Might have a good pre-ER run but will be not be taking a position on this monster on ER.
HDD trade ideas


Home Depot (HD) BullishI am not licensed or certified by any individual or institution to give financial advice. I am not a professional Stock trader.
I am calling Home Depot (HD) Bullish. I know this chart may seem cluttered, but there are several bullish indicators I see so please bear with me....or bull with me...or...never mind. Anyway, let's first look at the solid purple line. That is an Up Trending Support line. I have marked different places with green arrows and numbered them. If you look at green arrows number one and two along the purple Support line, and then find their corresponding numbered arrows above (look more toward the middle of the chart) there is a fifteen dollar ish ($15 ish) increase when it bounces off the purple support. Using that as a historic standard I have also drawn green arrow #3 at a bounce off purple support and a possible target for future Resistance, and drawn a purple dotted line to give a better target visual. However, it will need to clear the Resistance from January 26 & 29, 2018 (orange dotted line) to make it to that target.
That is the up trend. The Cup and Handle is another possibility showing bullish movement. The blue dotted line is the most recent edge of the Handle/Resistance (from June 12 & 13, 2018) which HD cleared today (07-19-18); or at least it has as of this publishing. Hopefully it doesn't disappoint. :) The orange solid line shows a previous Handle/Resistance which it cleared and continued up.
Other bullish signs can be called a possible Flag or Stair Stepping movement. That is just because it goes up, and then drops to Support, and then climbs again. The S&P 500 is still in a bullish recovery. See my previously published analysis on that for a visual example.
Any questions or further insight, let me know.


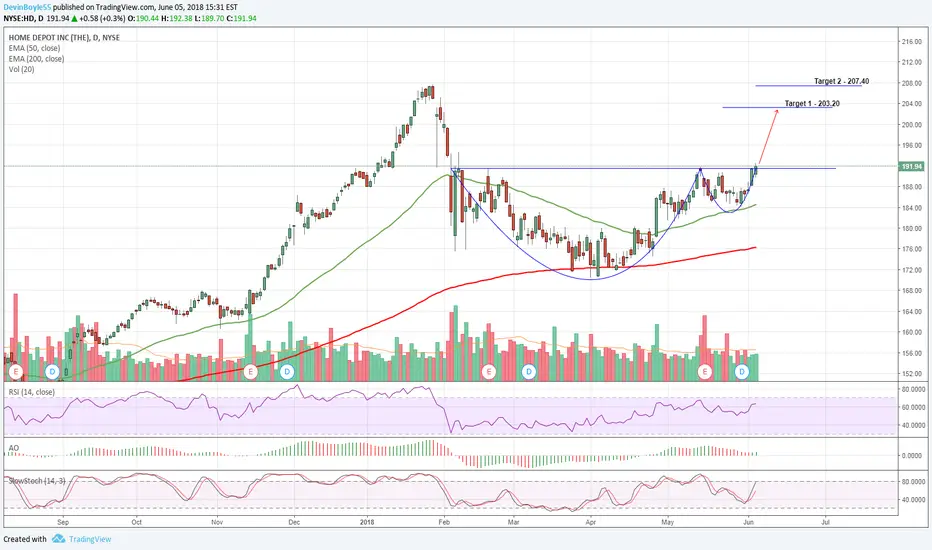
Home Depot Inverse Head and ShouldersTechnicals are looking good on this one.. NYSE:HD has room to run if the stock can bounce back to the $191.55 resistance. Stoch is nearing oversold territory and RSI is nearing a short-term trendline that should act as support. Volume dropping as the stock falls hints the bulls will soon come in, however, one must remember that high volume is not needed for a downtrend to continue.
I included a modified Modified Schiff Pitchfork and Fib retracement as HD has historically followed both quite closely.
Wait for a move to $191 or above before considering entry, I'd put a stop loss between $181 and $182.


Home Depot into Aug EPSAs we all know spring / summer is christmas for HD. By looking at 3 years Historical charts we can see home depot has an increase in share price of greater than 10% from mid June right into earnings. I am an options trader so one way i plane to capitalize on this move is a Risk Reversal Spread. I plan to sell the Aug 210/220c, while at the same time selling the 175p. This will make my debit .66. nice risk to reward. For a safer approach i recommend just doing a call vertical spread 210/220 for !.60. Still a great r/r trade.

Bullish Breakout on Home Depot & HomebuildersOn Friday's Options Action, the crew analyzed the performance of the homebuilder's sector. After selling off substantially since Jan, this sector has started to turn bullish again just this week. Looking for a bounce higher, HD is the large-cap name in this sector that would attract institutional investors. Coupled with cheap fundamental valuations and bounce off a bullish trendline, HD has upside to run. Expecting HD to trade higher, Michael Khouw suggests buying a July 200 Call for a $3.25 Debit. As of Friday's close, this option is trading at $3.60.
We've structured this trade in OptionsPlay so you can analyze and view this trade along with the supporting technical chart at your convenience.
View this OptionsPlay on HD - app.optionsplay.com


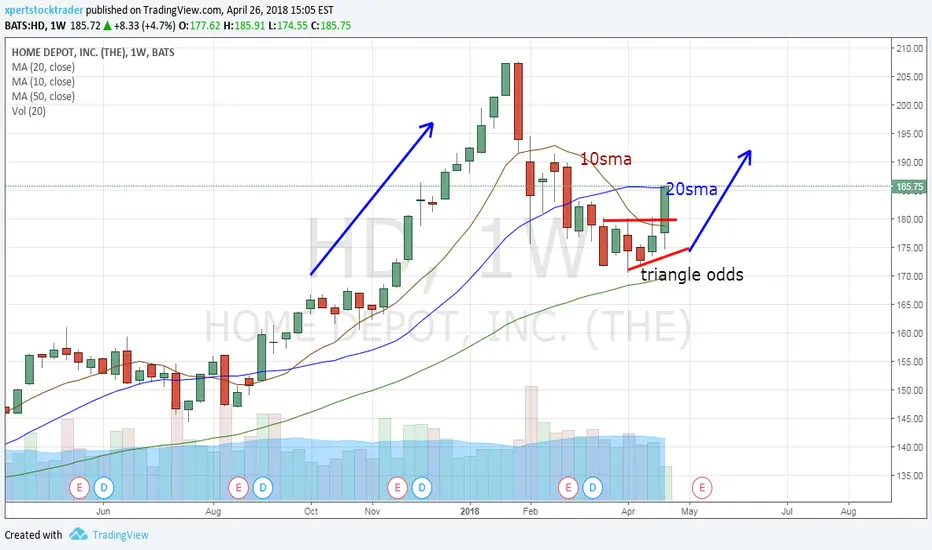
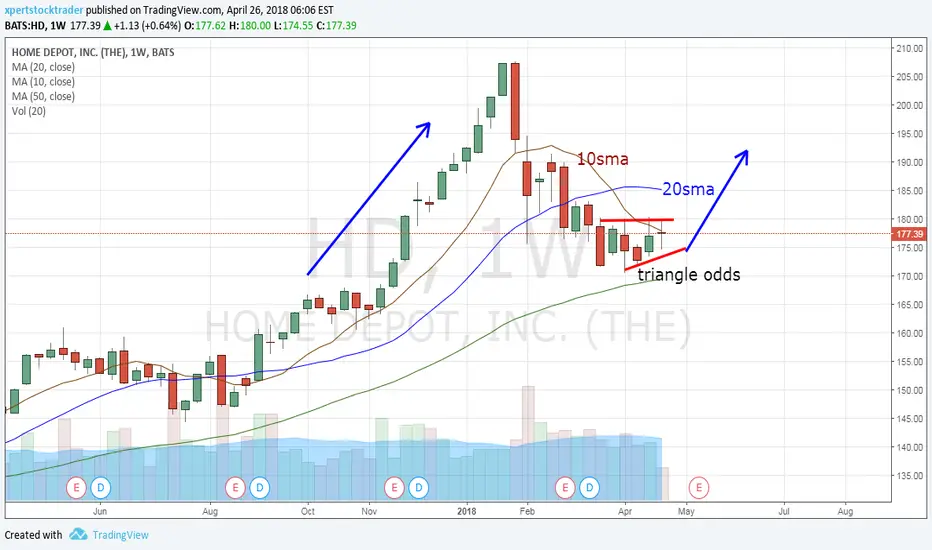
HD long opssibilityMain HD idea is possible monthly bounce from 10sma support area and possible flag pattern. Also, for that possibility HD need to break above weekly 10sma (at this moment resistance area) and above daily 50sma (green line on the chart). For trading plan, I use early entry and that is above 1st 60 min resistance area. Another swing option and less risk is above Tuesday high, but also then reward possibility is smaller.