JNJD trade ideas


Inverse Head and Shoulders Ascending TriangleJNJ has been struggling for quite a while..
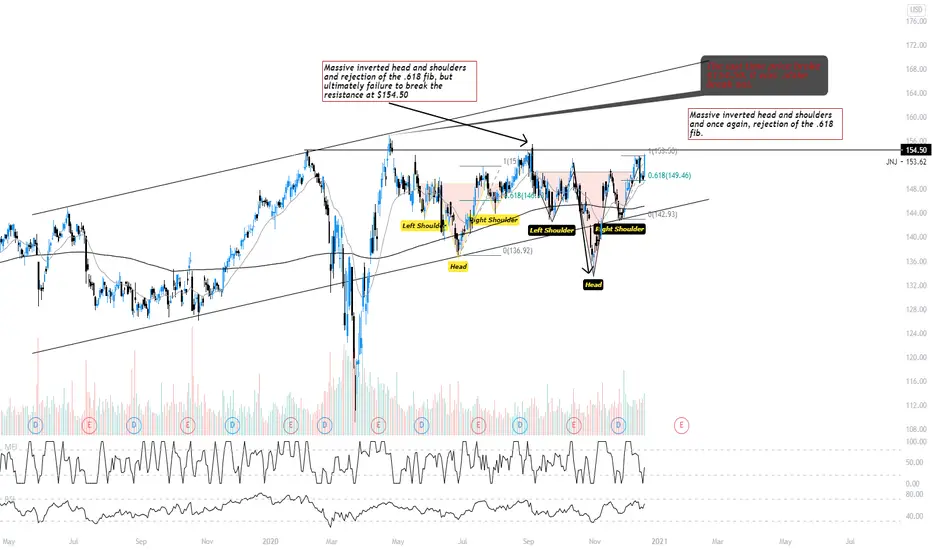
Tried to break from a V bottom earlier this year...formed a long range that is almost looking like a rectangle..H&S noted recently and shoulders/.head marked with stars. Price must break neckling with an uptrend for pattern to be valid.
Neckline is 151.40/Right shoulder is 144.75/Left shoulder is 142.95/Price has broken neckline but not positive a clear uptrend is in place yet..you be the judge..
Possible stop below 147, so fairly close by..
Not a recommendation..
The Head and Shoulders Bottom, sometimes referred to as an Inverse Head and Shoulders, is a reversal pattern that shares many common characteristics with the Head and Shoulders Top, except it is considered bullish verses bearish and can signal a trend reversal..
As a major reversal pattern, the Head and Shoulders Bottom forms after a downtrend, with its completion marking a change in trend. The pattern contains three successive troughs with the middle trough (head) being the deepest and the two outside troughs (shoulders) being shallower. Ideally, the two shoulders would be equal in height and width. The reaction highs in the middle of the pattern can be connected to form resistance, or a neckline.


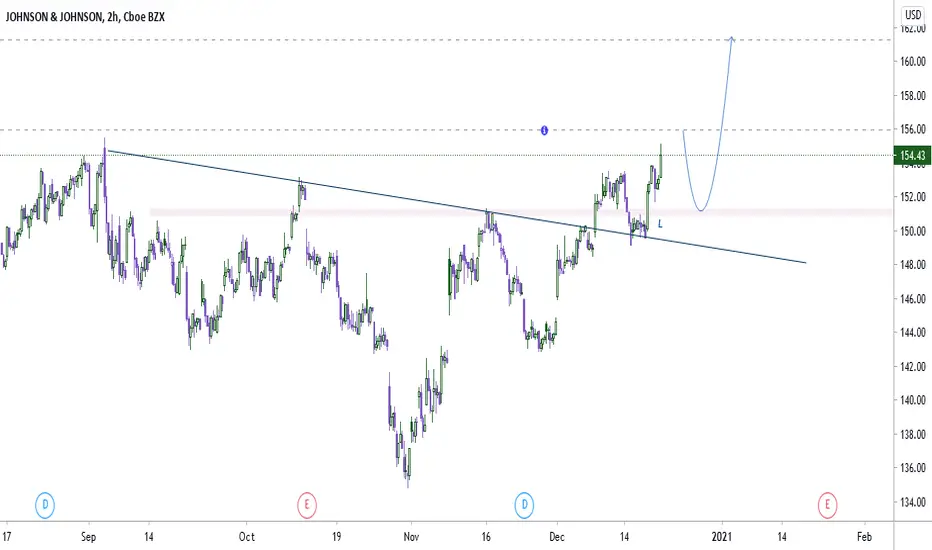
👀🚨SUNDAY WATCHLIST 12/27/20🚨👀JNJ - This one is currently at a key point and could be a great play in either direction. Holding tight to its uptrend on Friday which also happens to be this 13 EMA level, I will be watching to see which way it goes from here and play accordingly. Strong bounce on Monday I will look at 155-160 calls and breaking this uptrend I will look to play 150 - 145 puts. Just be careful of fake outs Monday morning or any news to solidify a potential move.


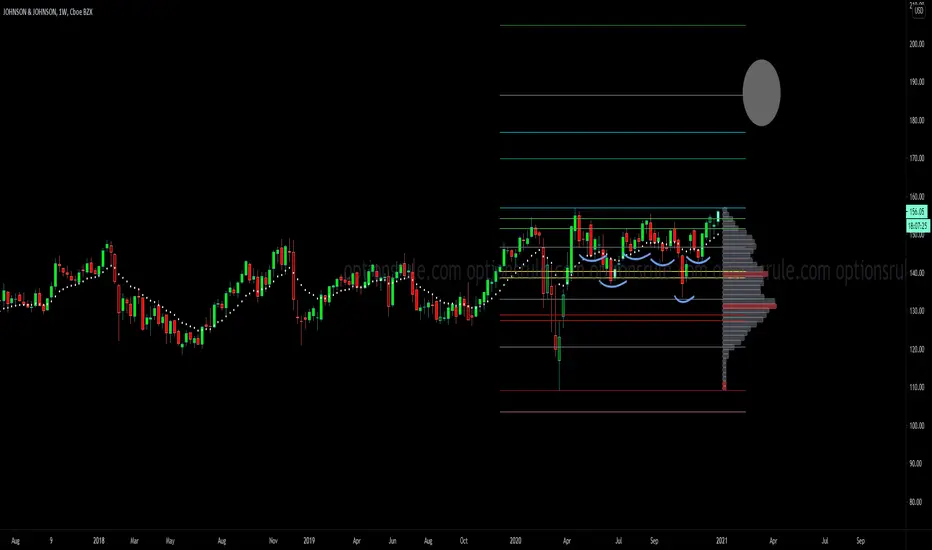
J&J's Buyers' Hesitation156 is a significant resistance because it is above 154.87 High, so we could see a drop from that zone and swing up.
It's looking bullish for J&J, and the nearest target is 158.62
K.
At this profile page, the shared analysis, ideas and also, the strategy of a chart belong to Khiwe. The technical set-ups are speculative, they are not guaranteed for accuracy or in completeness in the form of any content; -it is not to advice on financial markets. Please apply your own analysis and confirm it with price action.


$JNJ may breakout soon.There is a great deal to be bullish about for JNJ. I anticipate the price will find a nice runup as the recent bullish volume along with strong institutional exposure (70%) leads me to believe we find the price moving higher. The other fascinating observation is the strong earnings growth with virtually no new sales growth. This is a company run incredibly well & lean touting a net margin of 21%.
I like the EMA. I like that on this pass the Bollinger's are much higher in avg price & the price tapped mean reversion and continued to rise. Chart of this below, and the final chart will display pivot points for those that care about locating the war zone of support & resistance.
I am a JNJ Bull Folks.


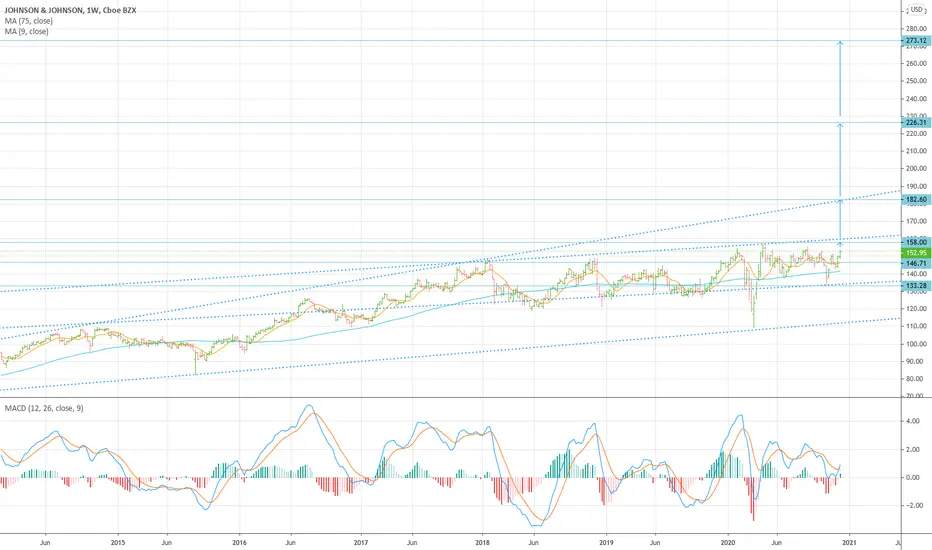
NYSE:JNJ Johnson stock price forecast, Buy Breakout, Target 226.Johnson & Johnson (NYSE: JNJ)
Trade : Buy Breakout
Entry : 158
Target : 226.31 (68.31, +43.23%)
Stop : 145 (-13, -8.23%)
Posted on Sunday, December 13, 2020
Note : Johnson & Johnson stock price hasn't moved for a long time. Stocks like this, once they begin to move, often show very big moves. Not sure yet, but JNJ stock seems to be preparing for a rise. It would be better to find opportunities to buy when the price break out 158.0. If the prediction is right, resistances could be 158, 182.60 and 226.31. Supports could be 146.71 and 133.28. If they have been preparing something very big, there is a possibility that their stock price could rise over 270 level.