Ascending Triangle With Breakout Incoming?📈 Ascending Triangle formation (bullish)
🔥 MACD crossover above signal line, bullish momentum gaining
✅ RSI at 61, showing strength but not overbought
📊 Watching for volume confirmation on breakout
Plan: Wait for daily close or strong intraday breakout above 160. If it confirms, this could be a strong swing setup. Watching closely!
SHOPIFY INC CEDEAR EACH 107 REPR 1 COM
1,340ARSD
−20−1.47%
At close at Jul 11, 20:00 GMT
ARS
No trades
SHOP trade ideas

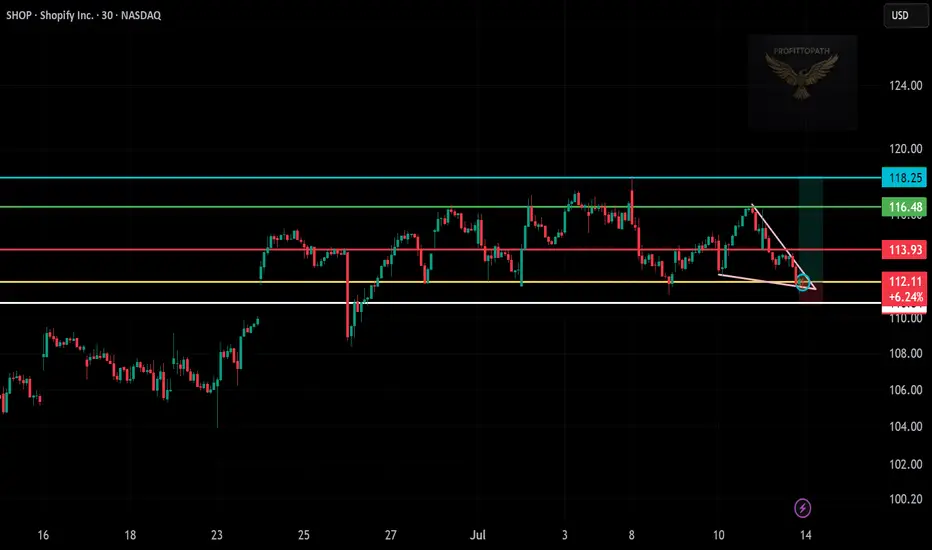
Trade Setup: Long on SHOP!📊
🕒 Timeframe:
30-minute chart
📍 Technical Overview:
Falling wedge breakout detected ✅
Support zone: $111.50–$112 (held well)
Breakout confirmation near $113
Target zones:
TP1 🎯: $116.48 (green resistance)
TP2 🎯: $118.25 (major resistance)
🔐 Risk Management:
Stop loss: Below $111.50 (white support)
Risk–Reward Ratio: Over 2:1 ✅
📈 Trade Plan Summary:
Entry: $113.00–$113.50 (breakout zone)
Target: $116.48 → $118.25
Stop loss: Below $111.50
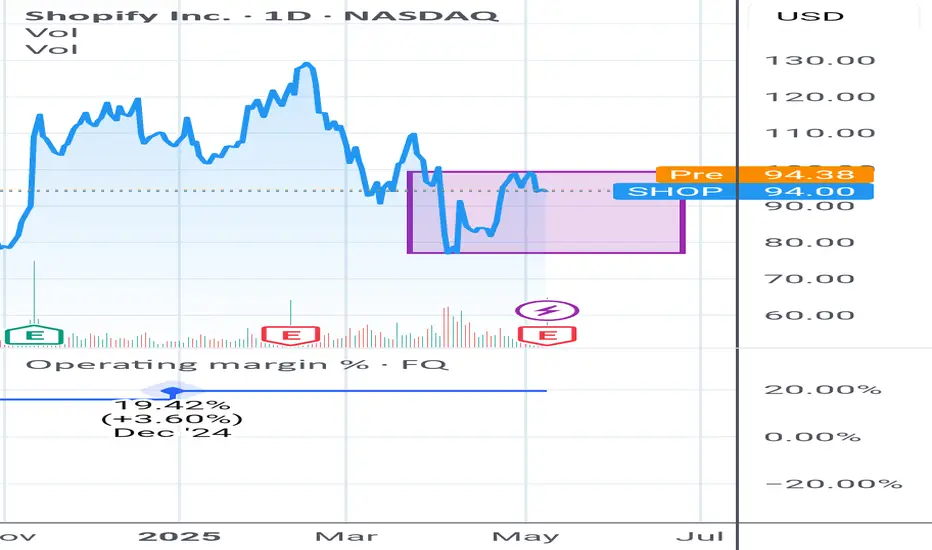
Trading box for SHOPThesis : the operating performance of SHOP's business is positive and it provides an optimistic outlook.
How to trade it: at this juncture the stock seems poised to go higher, therefore I will setup a trading box to confirm or deny the thesis.
Sell if it drops below 77
Buy if it breaks the 94/95 level.
Bullish Opportunity with Strong Technical Signals
Targets:
- T1 = $110.00
- T2 = $117.00
Stop Levels:
- S1 = $104.00
- S2 = $102.00
**Wisdom of Professional Traders:**
This analysis synthesizes insights from thousands of professional traders and market experts, leveraging collective intelligence to identify high-probability trade setups. The wisdom of crowds principle suggests that aggregated market perspectives from experienced professionals often outperform individual forecasts, reducing cognitive biases and highlighting consensus opportunities in Shopify.
**Key Insights:**
Shopify's bullish pennant pattern is signaling strong upward potential, with market sentiment favoring tech stocks. Seasonal strengths during the winter offseason provide additional clarity for positive performance in challenging macro conditions. Traders may find an opportunity to capitalize on Shopify’s momentum.
**Recent Performance:**
Shopify’s stock has shown stable price movement with signs of bullish momentum. The formation of a bullish pennant indicates an imminent breakout possibility, as traders maintain interest in tech-focused equities experiencing similar technical setups.
**Expert Analysis:**
Analysts highlight Shopify’s positioning among tech leaders, leveraging its seasonal advantages and strategic focus on merchants during less competitive periods. Along with positive chart formations, expert sentiment supports the view of upward price movement.
**News Impact:**
No major recent announcements were noted; however, Shopify’s offseason strategies have reinforced optimism in its ability to innovate and grow amidst fluctuating economic conditions. Technical signals underline its potential for positive performance in the short term.
**Trading Recommendation:**
Traders should take a bullish position on Shopify given its favorable technical signals and seasonal advantages. The breakout potential, coupled with stable market sentiment, makes this an attractive opportunity for upward movement toward the defined price targets.


Shopify's Technical Setup Signals Potential Upside Opportunity
Current Price: $105.34
Direction: LONG
Targets:
- T1 = $108.50
- T2 = $111.90
Stop Levels:
- S1 = $104.00
- S2 = $102.10
**Wisdom of Professional Traders:**
This analysis synthesizes insights from thousands of professional traders and market experts, leveraging collective intelligence to identify high-probability trade setups. The wisdom of crowds principle suggests that aggregated market perspectives from experienced professionals often outperform individual forecasts, reducing cognitive biases and highlighting consensus opportunities in Shopify.
**Key Insights:**
Shopify is at the center of the eCommerce space, demonstrating resilience despite economic shifts, including the weakening of pandemic-related tailwinds that had bolstered online retail demand. As the broader market leans toward international growth opportunities, Shopify’s expansion into key regions like Asia, including China, could yield significant upside potential. The company’s ability to innovate, coupled with its efforts to scale cross-border commerce, portrays a strong, forward-looking business agenda. Technically, Shopify exhibits a promising chart setup, with nearby support levels likely providing a foundation for further gains.
**Recent Performance:**
Shopify has been trading within a range over the past several weeks, consolidating around its current price level of $105.34. This price consolidation reflects mixed sentiment as market participants assess the implications of slowing growth in the eCommerce space. However, Shopify has shown signs of building momentum, with recovery from earlier pullbacks indicating the potential for buyers to retake control.
**Expert Analysis:**
Most analysts agree that Shopify’s adaptability and focus on long-term opportunities make it a promising stock for investors. The company’s international collaborative strategies, particularly its cross-border commerce initiatives, dovetail with improving retail sales trends in regions such as China. However, experts caution against complacency regarding competitive pressures, emphasizing the importance of Shopify’s continued innovation in the eCommerce ecosystem. Coupled with stable revenue growth and increased operating efficiency, the stock could attract positive sentiment soon.
**News Impact:**
Recent consumer data suggests a shift away from the pandemic-induced shopping boom, yet Shopify’s strategic investments in global growth partially offset these challenges. News of rising retail sales in China during shopping festival periods has presented the company with a favorable backdrop to bolster its international presence. Shopify’s partnerships and expansion across borders could further enhance its position in untapped markets as these trends continue to evolve.
**Trading Recommendation:**
Given Shopify’s robust technical setup, strategic international expansion, and favorable macro-driven retail trends, taking a long position appears justified at its current level of $105.34. Traders should target $108.50 and $111.90 in the short and medium terms, respectively, while employing stops at $104.00 and $102.10 to safeguard against volatility. Shopify’s resilience and innovation, paired with its promising growth runway, make it an attractive asset for bullish investors.

Shopify Escapes Tight ConsolidationShopify has been trapped in a tight range, but now the e-commerce stock may be breaking out.
The first pattern on today’s chart is the falling trendline since May 14 (based on closing prices). SHOP ended Friday above it, which may draw fence-sitters from the sidelines.
Second is the April high of $101.45. Prices tested below that level on May 23 but held. Has old resistance become new support?
Third is the narrowing Bollinger Band Width. Such a volatility squeeze may create potential for prices to expand following a period of compression.
Next, the 8-day exponential moving average (EMA) has stayed above the 21-day EMA. That may reflect short-term bullishness.
Finally, prices are near the rising 200-day simple moving average. That may suggest a longer-term uptrend is still in effect.
Check out TradingView's The Leap competition sponsored by TradeStation.
TradeStation has, for decades, advanced the trading industry, providing access to stocks, options and futures. If you're born to trade, we could be for you. See our Overview for more.
Past performance, whether actual or indicated by historical tests of strategies, is no guarantee of future performance or success. There is a possibility that you may sustain a loss equal to or greater than your entire investment regardless of which asset class you trade (equities, options or futures); therefore, you should not invest or risk money that you cannot afford to lose. Online trading is not suitable for all investors. View the document titled Characteristics and Risks of Standardized Options at www.TradeStation.com . Before trading any asset class, customers must read the relevant risk disclosure statements on www.TradeStation.com . System access and trade placement and execution may be delayed or fail due to market volatility and volume, quote delays, system and software errors, Internet traffic, outages and other factors.
Securities and futures trading is offered to self-directed customers by TradeStation Securities, Inc., a broker-dealer registered with the Securities and Exchange Commission and a futures commission merchant licensed with the Commodity Futures Trading Commission). TradeStation Securities is a member of the Financial Industry Regulatory Authority, the National Futures Association, and a number of exchanges.
TradeStation Securities, Inc. and TradeStation Technologies, Inc. are each wholly owned subsidiaries of TradeStation Group, Inc., both operating, and providing products and services, under the TradeStation brand and trademark. When applying for, or purchasing, accounts, subscriptions, products and services, it is important that you know which company you will be dealing with. Visit www.TradeStation.com for further important information explaining what this means.

Shopify has been trending steadily since 2022 Q4NASDAQ:SHOP is strongly in a steady uptrend since Oct 2022. Despite some strong correction in Feb 2025, the correction ended in a 3-wave manner before resuming its upside. We believe that the upside is likley to continue as the ascending triangle is strong.
Furthermore, the long and short-term momentum are in unsion, pointing towards a strong bullish momentum. Volume remain healthy.

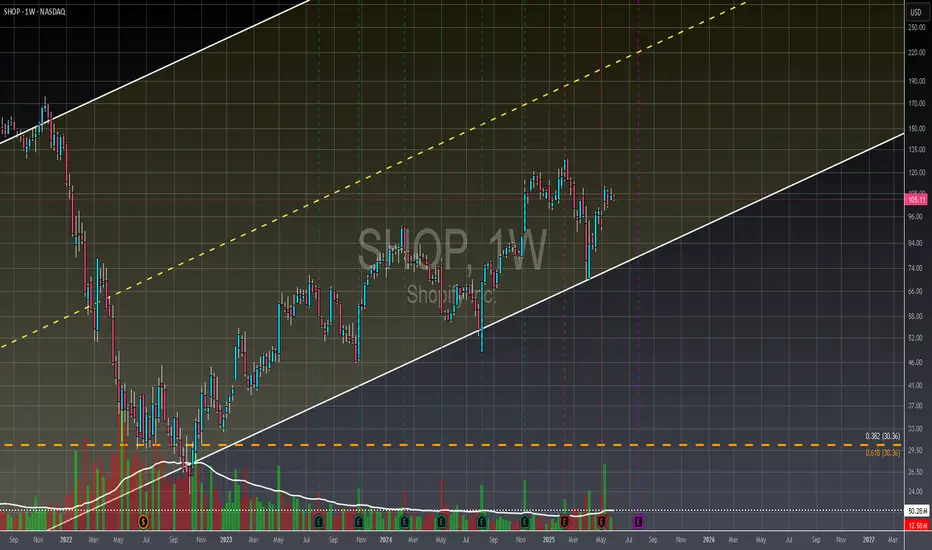
SHOP - Weekly - Future Looks PromisingShopify (SHOP) appears to be on a strong upward trajectory, technically positioned within a sustained monthly channel that suggests continued appreciation. This outlook is bolstered by consistent revenue growth since 2020 and a robust recovery from its 2022 net income deficit, with the company demonstrating improved free cash flow and cash equivalents in 2024. Given its healthy financials, dominant market share in e-commerce platforms over competitors like Wix and Squarespace, and high user engagement, Shopify presents a compelling long-term investment opportunity for those seeking a strong return on investment.
Not financial advice, always do your due diligence
Leave a like👍 and/or comment💬.
We appreciate and value everyone's feedback!
- RoninAITrader
SHOP Long trade ideaSpotted a strong reaction on Shopify as price tapped a key support level and bounced impulsively to the upside, even leaving a gap, solid confluences that point toward potential continuation.
What adds weight to this setup is that the price has reclaimed the 10 EMA, which typically signals momentum shifting back in favour of the bulls.
That said, one concern here is that volume appears a bit dry, which makes me a bit more cautious on this trade.
Trade is placed, now it's just about managing risk and letting the setup play out.


Trading Analysis for Shopify**Current Price:** $95.12
**Direction:** **LONG**
**LONG Targets:**
- **T1 = $98.53**
- **T2 = $102.63**
**Stop Levels:**
- **S1 = $91.57**
- **S2 = $88.57**
---
**Wisdom of Professional Traders:**
This analysis synthesizes insights from thousands of professional traders and market experts, leveraging collective intelligence to identify high-probability trade setups. The wisdom of crowds principle suggests that aggregated market perspectives from experienced professionals often outperform individual forecasts, reducing cognitive biases and highlighting consensus opportunities in Shopify.
**Key Insights:**
Shopify remains a pivotal leader in the e-commerce sector, benefiting from ongoing consumer preference for online shopping. Its robust payment systems and seamless integrations enable merchants to capture larger transaction values, increasing customer retention and loyalty. Recent expansions into mobile commerce further solidify its position as an innovator in the tech-driven retail landscape. The growth in secure credit-card transactions aligns perfectly with Shopify’s business model, underpinning its growth trajectory. Additionally, Shopify benefits from increasing demand for direct-to-consumer channels, providing it with an unparalleled advantage over traditional retail solutions.
**Recent Performance:**
Shopify’s market price has exhibited stability in recent weeks, consolidating around key support levels. The steady inflow of transactions suggests consistent demand for its platform, which is critical for maintaining growth momentum. While broader technology stocks have seen volatility, Shopify’s alignment with scalable e-commerce trends has positioned it as a relative outperformer in the sector. Recent pricing indicates resilience to external macroeconomic pressures, further emphasizing traders’ confidence in the stock’s upside potential.
**Expert Analysis:**
Analysts remain bullish regarding Shopify’s long-term outlook, citing strong fundamentals and sustained revenue growth. The company’s ability to adapt and align with emerging trends like AI-driven shopping experiences and direct-to-consumer ecosystems offers significant upside. Technical analysis highlights critical support levels holding firm, while the current chart patterns suggest potential breakout opportunities toward higher price targets. Experts also note Shopify’s impressive merchant retention rates and continuous investment in innovative tools as differentiators within the e-commerce space.
**News Impact:**
While there were no major recent headlines directly impacting Shopify, the ongoing rise in e-commerce adoption plays a key role in maintaining the company’s growth prospects. Broader economic trends, including digital-first retail strategies and advancements in online payment infrastructure, provide a positive backdrop for Shopify’s performance. Additionally, global shifts in consumer behavior toward mobile commerce and subscription-based shopping platforms continue to drive upside for the company’s market valuation.
---
**Trading Recommendation:**
Shopify presents a compelling long-term growth opportunity fueled by its industry-leading role in e-commerce innovation. With strong underlying fundamentals and solid technical setups, the stock is positioned for upside momentum. Traders should monitor the outlined stop levels to mitigate potential downside risk while targeting gains toward the specified price targets. Overall, SHOP offers a favorable risk-reward profile for investors looking to capitalize on the ongoing shift to digital commerce.
```

SHOP near 16 % targetHello, so this trading week was great in general for a turnover in trend after the selloff due to tariffs. Shopify is a great company and I prefer to enter with my personal technical confirmations, so extension on the profile the next week is What I hope it does. I aim for a 16 % target on this one.
Stay safe,
Sebastian.
Not financial advice.

$SHOP 35-50%+ downside from here. $41-59 targetAlthough NASDAQ:SHOP bounced higher today, it looks like the bounce will be short lived.
I think we will see a large move down over the coming weeks to the lower support levels on the chart.
Why? We just formed another lower high. We've been in a downtrend since late February and until the price action can start forming higher lows, or hit the targets below, I think this stock looks heavy and will fall lower.

Buying ShopifyI'm looking to start building a position in Shopify again. Last chart i did on this played out very well. My two green horizontals are based off monthly support levels. Low 80s to mid 60s are great areas to add. I become very interested below $70, maybe earning provides the fuel to get there.


ABC Correction?I can count a 5 wave impulse (subjective) and could see a potential ABC correction down to the $16 - $23 level. As someone who makes plenty of purchases from small retailers on the SHOP infrastructure, I'm ultimately long on this stock. I hope this stock doesn't see a year or more of sliding price action. That level could easily be hit, then recover much sooner than this chart predicts. TLDR; I'm charting a potential reversal level, not the time frame.

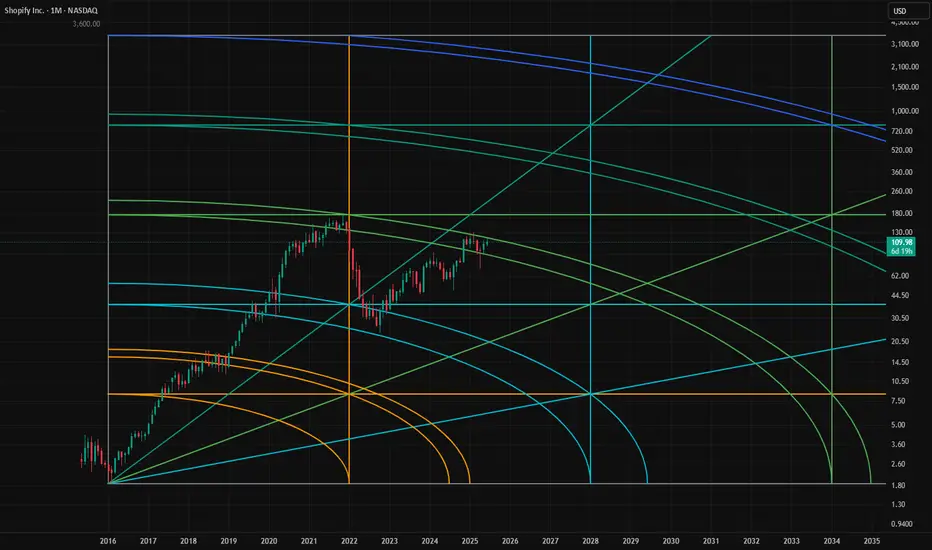
Shopify: Crazy Chart, Big LevelHave you ever seen a level as outstanding as this one? Yes, but this one's great too.
But will we ever get there though? Maybe with some tariffs action we do.
Outstanding level = strong level
We do have breakdown PA at the top (SFP) but the lack of structure in the downmove (2022) makes this less relevant as the lack of structure meant that price could easily come back up and not completely destroy the chart resulting in a downtrend.
This is clearly not an obvious uptrend, but I think the $23.63 level is that strong (because it stands out that much) that it makes up for it. But only if price keeps falling down to it like it's doing now: this way you don't get structure in the downmove (like in 2022), thus no resistance above the level after price would have hit it, increasing the chance of price holding and thereafter pushing up away from the level (likely in big fashion given the way price behaved before + this lack of structure).


Shopify - Reasons to add to my portfolio Nothing better than a bear market if you wanna make life changing profit.
I have been following Shopify since May 2021. Clarified where I will begin to buy.
40CAD and 23CAD were 2 of them.
Went long at 40 and will add at 23 if it keeps dropping.
40 was 2019 support
23 is 2018 resistance
My target is between 100-150
I am a long term investor and has alot of patience. Therefore, short time moves dont interest me.
In time, I created my own ETF by adding stocks which came to my point of interest and very happy with it.
Some are in profit some are not for now. My focus is total profit and will always be.
None of my comments are investment advise and are for my personal journal.

Way oversold, not too late to enter! TSX:SHOP is looking excellent for further upside. As inflation continues to drop, expectations for rising rates will also continue to drop. This is bullish for high growth stocks like SHOP. We are now above a key level (200 Day SMA), which often is the beginning of a technical bull market. Although I started my position a month ago, this stock is still tremendously oversold on the longer term charts and still has a lot of long-term potential for growth. I believe it's one of the most unfairly treated stocks this year by far on the TSX. The risk/reward looks favourable over the coming weeks and months, and the downside risk is now much lower than when inflation was continuing to climb every month.
