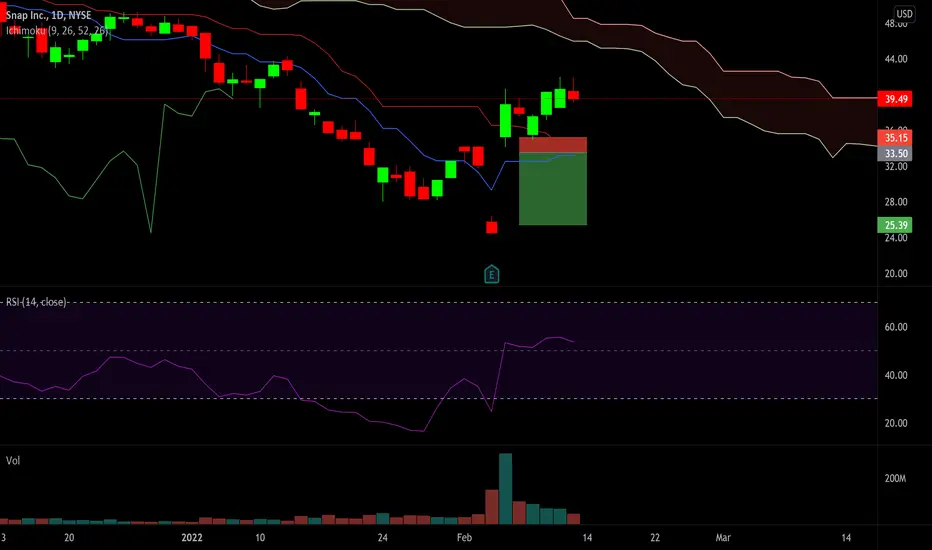
Is Snap Overbought?Snap had a sharp rally on February 4 after quarterly results beat estimates. But now its longer-term downtrend may be reasserting itself.
The first pattern on today’s chart is the stochastic oscillator. It’s swinging back to the downside after jumping into overbought territory.
Next, price tested but was unable to break above the 50-day simple moving average (SMA). That suggests the downtrend remains in effect.
Third, notice how the recent high occurred slightly above $40, near the mid-December low. It’s also close to the high-volume breakout area in October 2020. Has this price zone become resistance?
Finally, the macro backdrop may be challenging for SNAP given the weakness in growth stocks and the broader communications sector.
TradeStation is a pioneer in the trading industry, providing access to stocks, options, futures and cryptocurrencies. See our Overview for more.
Important Information
TradingView is not affiliated with TradeStation Securities Inc. or its affiliates. TradeStation Securities, Inc., TradeStation Crypto, Inc., and TradeStation Technologies, Inc. are each wholly owned subsidiaries of TradeStation Group, Inc., all operating, and providing products and services, under the TradeStation brand and trademark. When applying for, or purchasing, accounts, subscriptions, products and services, it is important that you know which company you will be dealing with. Please click here for further important information explaining what this means.
This content is for informational and educational purposes only. This is not a recommendation regarding any investment or investment strategy. Any opinions expressed herein are those of the author and do not represent the views or opinions of TradeStation or any of its affiliates.
Investing involves risks. Past performance, whether actual or indicated by historical tests of strategies, is no guarantee of future performance or success. There is a possibility that you may sustain a loss equal to or greater than your entire investment regardless of which asset class you trade (equities, options, futures, or digital assets); therefore, you should not invest or risk money that you cannot afford to lose. Before trading any asset class, first read the relevant risk disclosure statements on the Important Documents page, found here: www.tradestation.com .
SNAPD trade ideas

SNAP With the current market conditions being weak, lets play that strength; which at the moment might be this bearish momentum.. $36.30’s breaking can lead to a bigger short to test previous longs at the $35 range, if the intentions succeed and they are shaken out, this can only head lower possibly sub $33.


Bearish short term setupSNAP failed to break the .5 fib retracement and the upper level of the descending channel. The boost from earnings weren't enough to get it done so I suspect SNAP will fall back down to the lower level of the channel or maybe even break it to fill to open gap. The inflation/Russia conflicts should also be a greater force pulling the general market down. I'll look to add a short position on Tuesday.
This is not financial advice.

Snap's futureSnap performs quite well, despite the broad market weakness.
I am seeing a huge opportunity here, but first, we might tank a bit more.
Even to the P Pivot (36,03), and that will be a good entry point.
If it gets below that, the picture will turn bearish.
Support: 36,03
Resistance: 44,11


Been here many times beforeOh Snap, anything if not predictable.
Done this song and dance before with SNAP, especially around earnings time.
Can you see it?
If not, check out the hourly chart and it will become clear.
If we can manage to open around 39$, we will likely retest the 40s zone. From there is where I will likely enter short.
There is the possibility it could retest 44 (I wouldn't hold my breath and I wouldn't bet money on it), but its unlikely.
If it manages to break 42.13 then we can anticipate a retest of 44, but again, its not looking promising.
Best of luck tomorrow everyone!


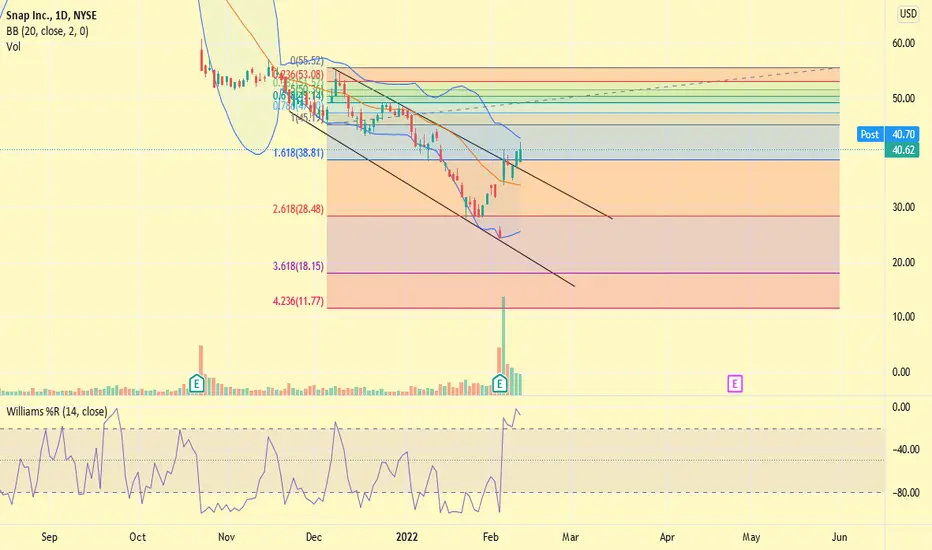
Snap staged for a reversal?Snap has been trading mostly within a falling channel on the daily chart since Oct. 22. A falling channel is considered bearish until a stock breaks up from the upper descending trendline of the pattern.On Thursday, Snap was attempting to break up bullishly from the falling channel. If the stock does so, it will regain support at the 50-day simple moving average, which would mean longer-term sentiment has turned bullish. Snap began the trading day with an inside bar but quickly broke up above Wednesday’s highest price, which in Snap’s case caused the eight-day exponential moving average (EMA) to cross above the 21-day. Snap has resistance above at $43.26 and $47.92 and support below at $39.96 and $37.35.


SNAP DESCENDING CHANNELSnap has been in a downtrend and with the recent earnings it has Snapped back into the descending channel. If we see a (Break Out) it will most likely be a fake out. Starting a short position at this level, Stop loss is if the weekly chart shows Bullish trend reversal. Profit take at $34.52

SnapChat (NYSE: $SNAP) Charging Up The Chart Pre-Market ⚡Snap Inc. operates as a camera company in the United States and internationally. The company offers Snapchat, a camera application with functionalities, such as Camera, Communication, Snap Map, Stories, and Spotlight that enable people to communicate through short videos and images. It also provides Spectacles, an eyewear product that connects with Snapchat and captures video from a human perspective; and advertising products, including AR and Snap ads. The company was formerly known as Snapchat, Inc. and changed its name to Snap Inc. in September 2016. Snap Inc. was founded in 2010 and is headquartered in Santa Monica, California.

$SNAP Big short opportunity -Will be looking to see how this gap fills now gaps can take years to fill or they can fill instantly
-will be watching to see if we can break into the gap and profit off the gap fill
-First PT will be 32.39 then after that we are looking to go down to 25.31
-For now keep this on watch no clear set up then no entry


