3 Oversold Stocks Poised for a Rally – MAS, IQV & TMOBelow is today’s SmartApingAI snapshot of three highly oversold names showing early signs of a rebound. Scroll down for a quick refresher on each company’s fundamentals, key technicals, and what makes them attractive at current levels.
1. Masco Corp ( NYSE:MAS )
What They Do:
Masco designs, m
0.70 USD
5.63 B USD
38.09 B USD
About Thermo Fisher Scientific Inc
Sector
Industry
CEO
Marc N. Casper
Website
Headquarters
Waltham
Founded
1960
ISIN
ARBCOM4601F7
Thermo Fisher Scientific, Inc. engages in the provision of analytical instruments, equipment, reagents and consumables, software, and services for research, analysis, discovery, and diagnostics. It operates through the following segments: Life Sciences Solutions, Analytical Instruments, Specialty Diagnostics, and Laboratory Products and Biopharma Services. The Life Sciences Solutions segment provides a portfolio of reagents, instruments, and consumables used in biological and medical research, discovery, and production of new drugs and vaccines. The Analytical Instruments segment offers instruments and the supporting consumables, software, and services that are used for a range of applications. The Specialty Diagnostics segment includes a wide range of diagnostic test kits, reagents, culture media, instruments, and associated products to serve customers in healthcare, clinical, pharmaceutical, industrial, and food safety laboratories. The Laboratory Products and Biopharma Services segment is involved in virtually everything needed for the laboratory. The company was founded on October 11, 1960 and is headquartered in Waltham, MA.
10.0%
11.6%
13.2%
14.8%
16.4%
Q1 '24
Q2 '24
Q3 '24
Q4 '24
Q1 '25
0.00
3.00 B
6.00 B
9.00 B
12.00 B
Revenue
Net income
Net margin %
Revenue
COGS
Gross profit
Op expenses
Op income
Non-Op income/ expenses
Taxes & Other
Net income
0.00
2.60 B
5.20 B
7.80 B
10.40 B
Revenue
COGS
Gross profit
Expenses & adjustments
Net income
0.00
2.60 B
5.20 B
7.80 B
10.40 B
No news here
Looks like there's nothing to report right now

Still uncertain of continuing decline on 2 oscillatorsThe support matches that of the past, a fall from a 100 may not be enough to stop it, but inside the channel, as long as the break from it lands on that support line shy of 500, then we have a counter bounce which could prove a significant possibility gaining 20 points. Target 520 with a trailing st
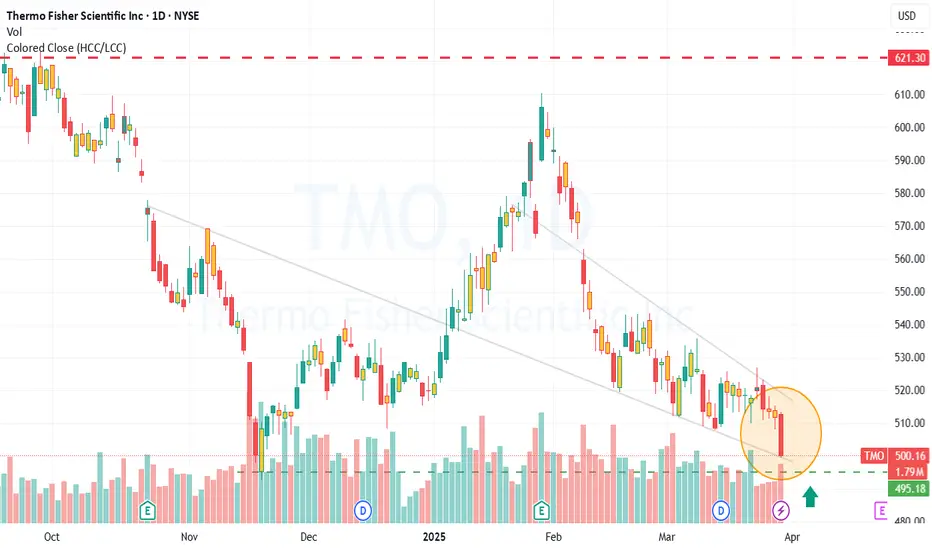
Plus on Thermo Fischer. TMOThe last take on TMO brought 7.5% profit in 13 days. It was manly based on Harmonic/RSX OBOS combo signature. The change in the candle stick tendency now might be an earliest of the earliest signs of a pivot. This is a very risky take, given limited evidence: Stoch/RSI cross, vWAP cross, US support

Betting on Cool Down at Thermo Fischer. TMOIt's not a perfect butterfly, but I am willing to take a shot given the wealth of evidence in the background from our algorithmic indicators. MIDAS cross line plus resistant vWAP and US, which also crossed 4-5 candles ago, plus cross on VZO and heralding cross on Stoch/RSI. BB %PCT is about to flip

TMO Long Idea- Price has retested and held the weekly descending trendline
- on the daily timeframe, price has formed 5 waves and is holding the 0.618 retracement
- enter now with a stop loss at the previous swing low around 494
- upside levels to watch: 540, 570, 620
- beyond 620, new ATHs can be expected

looking at sub 500 levels just can't seem to find the bottomReading many timeframes and patterns, it's a simple concept along with good or bad fundamentals, and of course, the catalyst is to sell the news or buy the speculation. In this case, reading the chart, we see oscillators that are turning to the downside, we don't see confirmation of the bottom, we s


TMO Thermo Fisher Scientific Inc. (TMO) is currently experiencing a mixed financial and market performance. Here is a technical analysis of the stock as of November 2024:
1. **Recent Performance**: TMO's Q3 2024 earnings per share (EPS) came in at $5.28, slightly exceeding analyst estimates of $5.25, w


See all ideas
Displays a symbol's price movements over previous years to identify recurring trends.
US883556CM2
THERMO FISH. 21/41Yield to maturity
6.71%
Maturity date
Oct 15, 2041
TMO4530434
Thermo Fisher Scientific Inc. 4.1% 15-AUG-2047Yield to maturity
6.33%
Maturity date
Aug 15, 2047
TMO5630948
Thermo Fisher Scientific Inc. 5.404% 10-AUG-2043Yield to maturity
5.77%
Maturity date
Aug 10, 2043
TMO4078058
Thermo Fisher Scientific Inc. 5.3% 01-FEB-2044Yield to maturity
5.72%
Maturity date
Feb 1, 2044
XS205855734
THERMO FISH. 19/49Yield to maturity
5.23%
Maturity date
Oct 1, 2049
TMO5710956
Thermo Fisher Scientific Inc. 5.2% 31-JAN-2034Yield to maturity
5.00%
Maturity date
Jan 31, 2034
TMO5630927
Thermo Fisher Scientific Inc. 5.086% 10-AUG-2033Yield to maturity
4.96%
Maturity date
Aug 10, 2033
US883556CL4
THERMO FISH. 21/31Yield to maturity
4.95%
Maturity date
Oct 15, 2031
US883556CU4
THERMO FISH. 22/32Yield to maturity
4.86%
Maturity date
Nov 21, 2032
See all TMOD bonds