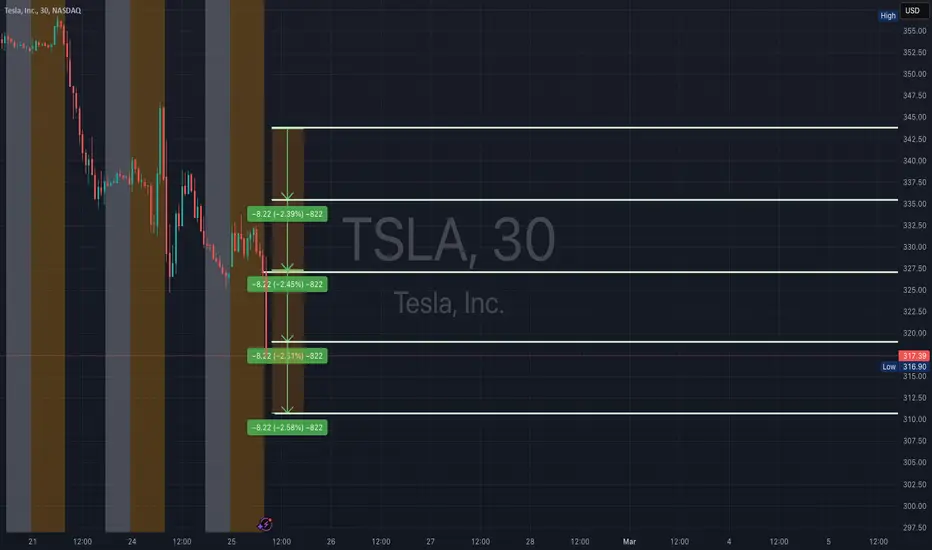
TSLA support & resistant areas for today Feb 25, 2025NASDAQ:TSLA So these are the support and resistant points for TSLA. Bounce off on these areas can initiate long or short positions.
If yall want me to post this every morning 9.30am please boost and follow me, so i know it is valuable for yall. Thank you
TSLAB trade ideas
TSLA - Predictable as always. Just look for the controlled liq!We've done this countless times on this stock. I didn't touch this while we were shooting up post elections because of the "meme" factor behind Elon and all that. But once basic market dynamics came back into play, we've had at least 2 golden opportunities to play this name and they proved very successful. So going forward we're looking for a similar play!
Happy Trading :)

WHAT COULD HAPPEN NEXT TO TESLA STOCK?Tesla stock is in a potential reversal zone: Strong Aroon Up + RSI near oversold + Williams %R oversold. Watch for a breakout above key resistance to confirm a bullish move.
If RSI stays weak & Aroon Up falls, the stock may continue sideways or dip further.
Tesla's stock as of February 25, 2025, based on the latest data.
Current Price: $330.53
Updated Support Levels:
First Support: $325
Second Support: $265
Updated Resistance Levels:
First Resistance: $430
Second Resistance: $489
These levels are derived from recent technical analyses and are crucial for traders to monitor. The support at $325 is particularly significant, as a drop below this could indicate further declines. Conversely, breaking above the $430 resistance may signal renewed bullish momentum.

TSLA Technical Analysis & GEX Options Setup for February 26📌 Key Observations from the Charts
1. Market Structure & Price Action:
* TSLA had a major breakdown from 348-350, falling to 337.20 and consolidating.
* Support Levels:
* 337.20 (current price zone, high liquidity).
* 330.00 (negative NETGEX & next major put wall support).
* 320.09 (third put wall, high-risk breakdown level).
* Resistance Levels:
* 348.01 (prior breakdown level, first resistance).
* 356.76 (Value Area High & rejection level).
* If TSLA loses 330, expect sharp downside acceleration toward 320.
2. Volume Profile & Auction Levels:
* Point of Control (POC): 337.35 → High liquidity, potential reaction zone.
* Value Area High (VAH): 348.01 → Key resistance.
* Value Area Low (VAL): 334.42 → Must hold to avoid more downside.
3. Indicators Review:
* MACD: Bearish, with downside momentum still increasing.
* Stochastic RSI: Oversold but not rebounding yet—no bullish reversal confirmation.
🛠️ Options GEX Analysis
* Call Resistance:
* 380-400 → High gamma resistance, strong call walls preventing upside.
* 450 → Extreme call wall unlikely to be tested unless strong bullish momentum returns.
* Put Walls & Support Zones:
* 330 → Highest Put Wall & Negative NETGEX Support.
* 320 → Critical third Put Wall—if lost, it could trigger a larger breakdown.
* Implied Volatility (IVR & IVx):
* IVR 37.1 | IVx Avg 70 → Higher volatility than previous stocks, meaning wider swings expected.
* Call Positioning 50.5% → Some bullish bets, but still overshadowed by put-heavy positioning.
📈 Trade Setups & Game Plan
🔴 Bearish Scenario (Preferred Setup)
🔹 Entry: Short below 334 confirmation.
🔹 Target 1: 330.00 (Put Wall Support).
🔹 Target 2: 320.00 (Put Wall Break).
🔹 Stop-Loss: Above 342 (invalidates breakdown).
🔹 Options Strategy:
* Buy PUTS 335/320 expiring 1-2 weeks out if breakdown confirms.
* Debit Put Spread (Bearish 335P/320P for risk control).
🟢 Bullish Scenario (Less Likely)
🔹 Entry: If price reclaims 342-348, targeting 356+.
🔹 Target 1: 348.01 (first resistance).
🔹 Target 2: 356.76 (major resistance zone).
🔹 Stop-Loss: Below 335 invalidates upside move.
🔹 Options Strategy:
* Sell 320/315 Put Credit Spread for a bounce play.
🎯 My Thoughts & Suggestions
* Main Bias: Bearish, unless 342+ is reclaimed.
* Gamma Risks: Below 330, strong gamma exposure can push TSLA lower quickly.
* Options Play: Puts look stronger based on GEX positioning & technical weakness.
⚠️ Disclaimer
This analysis is for educational purposes only and does not constitute financial advice. All trading involves risk, and past performance is not indicative of future results. Please do your own research and consult a professional financial advisor before making any investment decisions.


Tesla - The Failed All Time High Breakout!Tesla ( NASDAQ:TSLA ) will reject the all time high first:
Click chart above to see the detailed analysis👆🏻
Tesla was actually not able to create a sustainable all time high breakout and if a stock doesn't move up, it will come down. However Tesla still remains absolutely bullish and is now starting to create a textbook break and retest which will eventually still lead to new all time highs.
Levels to watch: $400, $280
Keep your long term vision,
Philip (BasicTrading)

2/24/25 - $tsla - High on watchlist to own...2/24/25 :: VROCKSTAR :: NASDAQ:TSLA
High on watchlist to own...
- fundamentally, there's a lot of "if this" priced into the stock, there's no denying it
- even round up '26 FCF from 8 bn (current expectation) to 10 bn and you're at a 1% yield. but also acknowledge... here it is again... "if, then" it's also growing at 100% yoy, and likely dirty cheap too
- seeing that grok 3 deployment, the DOGE work, rockets, video game, edgelord X... let's get this straight, Elon is
1/ not someone to bet against
2/ continues to deliver surprises across the board
3/ is at and defining the intersection of AI, robots, energy and US-first policy
- so while we can look at multiples all day, i think NASDAQ:TSLA remains a bet on what Elon can deliver in a 10Y context with a high discount rate.
- if robotaxi, optimus... solar roofs (y'all know my view on solar as % of generation) all come together nicely, there's little doubt in my mind that he's right, NASDAQ:TSLA is probably the largest publicly traded company, and make up a number, $10 tn+.
- so if we reduce the probability wave into a duality, "success" and "fail" and nothing in between (for simplicity, albeit an imperfect representation of reality).
- if success is $10 tn in 10 years
- and fail is a bagel ($0) in 10 years
- and we use a LT investment discount rate of 10% ("low enough" to capture the market's current view of stocks at 3-4% for megacap, moat/ validated names but low, but "high enough" to also factor in failure, waiting period etc. etc.)... that $10 tn in today's terms would be 10/(1.1^10) = 3.9 tn. so...
3.9 tn * 10% + 0 tn * 90% = 3.9 tn.
market might be saying... how about it's a 20-25% chance of success and nothing in between. or the market could be saying 10% chance of this success but also many scenarios in between that also give us 1 tn, 2 tn etc. of value. and as a result, the "real" valuation today perhaps does sit closer to that $1tn valuation.
the conclusion, for me, is that technicals matter more for a name like NASDAQ:TSLA in the short-term (like they do CRYPTOCAP:BTC ) than in the long-term as these fundamental factors are delivered (or not) and cash is generated (or not).
the gap fills in the low $200 do catch my eye. those are pretty large gaps. ESPECIALLY the post-election gap, which was more of an "elon benefits from being close to trump" and not necessarily (*necessarily* - though i see it both ways) a speed-up of these above mentioned fundamental factors.
I'd be eyeing the mid $200s to get involved again if/when.
i do think the stock is a LT buy at today's levels. but i just don't like the R/R given the drawdown potential (based on above logic) compared to other opportunities in my book today, namely NASDAQ:NXT , CRYPTOCAP:BTC , NYSE:UBER , $tsm.
but i'll be watching carefully and i'm willing to jump in higher if i need to. that's cool too. just not yet.
V


TSLA is targeting 295 & 330 & 430Hello Traders,
I'm sharing a long position on TSLA, and I'll explain my reasoning below.
Entry Price: 223
Stop-Loss: 172
1st Target: 295
2nd Target: 380
Reason 1: The price has rebounded from the lower deviation of the uptrend channel (grey), not the lower deviation of the downtrend channel (blue). It is now targeting the upper deviation resistance line of the uptrend channel (grey) at 295.
Reason 2: A cup & handle pattern is progressing and will likely be confirmed if the price closes a weekly bar above 253 and the target will be around 330,380 and maybe 430 as shown below
NASDAQ:TSLA


TESLA Stock Chart Fibonacci Analysis 022225Trading Idea
1) Find a FIBO slingshot
2) Check FIBO 61.80% level
3) Entry Point > 349/61.80%
Chart time frame: B
A) 15 min(1W-3M)
B) 1 hr(3M-6M)
C) 4 hr(6M-1year)
D) 1 day(1-3years)
Stock progress: B
A) Keep rising over 61.80% resistance
B) 61.80% resistance
C) 61.80% support
D) Hit the bottom
E) Hit the top
Stocks rise as they rise from support and fall from resistance. Our goal is to find a low support point and enter. It can be referred to as buying at the pullback point. The pullback point can be found with a Fibonacci extension of 61.80%. This is a step to find entry level. 1) Find a triangle (Fibonacci Speed Fan Line) that connects the high (resistance) and low (support) points of the stock in progress, where it is continuously expressed as a Slingshot, 2) and create a Fibonacci extension level for the first rising wave from the start point of slingshot pattern.
When the current price goes over 61.80% level , that can be a good entry point, especially if the SMA 100 and 200 curves are gathered together at 61.80%, it is a very good entry point.
As a great help, tradingview provides these Fibonacci speed fan lines and extension levels with ease. So if you use the Fibonacci fan line, the extension level, and the SMA 100/200 curve well, you can find an entry point for the stock market. At least you have to enter at this low point to avoid trading failure, and if you are skilled at entering this low point, with fibonacci6180 technique, your reading skill to chart will be greatly improved.
If you want to do day trading, please set the time frame to 5 minutes or 15 minutes, and you will see many of the low point of rising stocks.
If want to prefer long term range trading, you can set the time frame to 1 hr or 1 day.

TSLA Harmonic Elliott Wave and Hurst's Cyclic AnalysisI view the move from April to December 2024 as wave A of 3. Since then, we have been in wave B of 3, forming a double zigzag correction. Currently, we are in the final stages of completing this correction and preparing for a strong bullish move as wave C of 3.
To estimate the bottom, we analyze the retracement of wave A of 3. A 0.586 retracement suggests a level of 285, while a 0.618 retracement points to 274.
From a cycle perspective, the April 2024 trough marked an 18-month cycle low. We are now nearing the completion of the first 40-week cycle within this 18-month cycle, with the trough expected in the first week of March.

TESLA Expected Growth! BUY!
My dear followers,
I analysed this chart on TESLA and concluded the following:
The market is trading on 337.50 pivot level.
Bias - Bullish
Technical Indicators: Both Super Trend & Pivot HL indicate a highly probable Bullish continuation.
Target - 382.40
Safe Stop Loss - 313.62
About Used Indicators:
A super-trend indicator is plotted on either above or below the closing price to signal a buy or sell. The indicator changes color, based on whether or not you should be buying. If the super-trend indicator moves below the closing price, the indicator turns green, and it signals an entry point or points to buy.
———————————
WISH YOU ALL LUCK


TESLA: The best buy entry is here. $600 long term.Tesla is bearish on its 1D technical outlook (RSI = 37.443, MACD = -16.180, ADX = 38.976) as it is expanding the bearish wave of the Channel Up, under the 1D MA50. As the 1D RSI rebounded at 30.000 and the 1D MACD is close to a BUllish Cross, we see a striking resemblance with the lows of August 5th 2024 and April 22nd 2024. With the help of the 1D MA100, we expect the price to start making a slow recovery. Go long on this bullish wave, TP = 600.
## If you like our free content follow our profile to get more daily ideas. ##
## Comments and likes are greatly appreciated. ##

TSLA swing trade ideaTSLA had the same setup today as other posts I have made. I have already cashed out on this position and leaving only few. Intraday profits were nice and intraday targets were met, so this trade is risk free as first target has already been reached. This seems to be a long and time consuming trade but the reward is there. Rejection from weekly sellside ineffieciency buyside imbalance with further displacement in ltf will give further confluence on the trade. There maybe entry opportunities next week as price may retrace to inefficiencies. The draw seems to be pretty obvious on the weekly time frame. We will need to see if it delivers, if it does deliver how and when.


TSLA Short - IntradayWith bearish indices, and displacement in TSLA on H4 time frame the narrative was bearish sentiment from that point of interest. As soon as I saw rejection from the POI, I waited for confirmation of my setup in the 15m and entry on the 5m, with 1: 3.3 risk to reward. The RR target was based on the sell stops resting below creating liquidity with Previous Day Low and Sellside Liquidity.


Summary of Tesla (TSLA) *Summary of Tesla (TSLA)
Company Overview
*
Business Focus: Tesla designs, manufactures, and sells electric vehicles, as well as clean energy products such as battery storage systems and solar panels.
Market Presence: Widely considered one of the leading electric vehicle (EV) manufacturers, Tesla has a strong global footprint with multiple Gigafactories.
Revenue Streams: Primarily from EV sales (Model 3, Model Y, Model S, Model X, etc.), with growing contributions from energy storage and solar.
Market Cap: Generally among the largest automakers by market capitalization.
Investor Interest: Tesla tends to have high trading volumes and significant retail and institutional investor interest.
*Key Metrics Often Featured*
EPS (Earnings per Share) & Revenue: Monitored closely due to Tesla’s historically high valuations and the market’s focus on profitability.
P/E Ratio (Price-to-Earnings): Can be relatively high compared to traditional automakers, reflecting growth expectations.
Analyst Ratings: Typically span a wide spectrum, from strong bullish (on growth and tech leadership) to bearish (on valuation concerns).
*Recent/Relevant News Themes*
Deliveries and Production Updates: Investors watch Tesla’s quarterly delivery numbers closely, as they are a direct measure of demand and production capacity.
Margin and Price Cuts: Over time, Tesla has occasionally adjusted vehicle prices, which may affect its profit margins.
Competitive Landscape: Increasing EV competition from legacy automakers and other EV startups.
_*Short-Term Outlook*_
Analysts watch each earnings report for guidance on deliveries, production ramp, and margin trends.
As per the text you shared, there’s mention of analysts having reduced the upcoming quarter’s EPS expectations from $1.01 to $0.52. This implies a roughly –48% revision, which could signal either near‐term challenges or conservative estimates for the quarter.
Q1 2025 earnings (on or around April 29, 2025) will shed light on Tesla’s ability to execute on its production and sales targets, as well as the broader macro environment’s impact on EV demand.
*Analysis of Chart*
chart highlights several potential price levels and a notional “wave” of upward movement. Here are the main points:
Current Price Region (Mid–300s)
chart shows the stock trading somewhere in the $340–$360 zone, near a “PIV Point” around $354. This pivot might be a psychological or technical level that traders watch for support/resistance behavior.
Potential Support Levels
$344–$345 area: Marked on chart as a lower boundary that might serve as support. If Tesla retraces, traders might look for a bounce here before any upward move.
$299 level: Although not shown as immediate support in wave projection, have highlighted in chart (orange line), suggesting a historically important region. A break below $300 would likely signal stronger bearish momentum.
Potential Resistance / Upside Targets
$384.72 and $414.24: Your next two labeled points—these presumably act as stepping‐stone targets if Tesla bounces from the mid‐300s.
$413.71–$414 range: identified this as another resistance. A sustained push above $414 would indicate bullish momentum.
$488–$520 range: While higher up, these levels (also indicated in chart with dotted lines) represent upper resistance zones from past price action or psychological round‐number resistance.
Earnings and the “Catalyst” Timeline
Marked an upcoming Earnings event (Q1 2025 on April 29). Earnings can spark higher‐than‐usual volatility. If results exceed or disappoint expectations (particularly on EPS and margins), it can cause a rapid move either up or down.
The chart’s green “wave” suggests you anticipate a slow climb into and after earnings, possibly fueled by bullish sentiment if Tesla meets or exceeds the newly lowered EPS targets.
*Technical Outlook*
In drawing, a short‐term pullback (dip to around $344) before reversing higher.
Breaking the $354 pivot convincingly could confirm a bullish move, aiming for $384 and ultimately $414.
Volume behavior is another key factor—chart shows moderate volumes, so a spike in buying or selling volume could confirm or invalidate the price wave .
*Concluding Remarks*
*Fundamental Context*
Tesla’s lowered EPS estimates for the upcoming quarter raise questions about near‐term profitability or potential one‐time items. The company often surpasses or misses Wall Street estimates in dramatic fashion, keeping investors on alert around earnings announcements.
*Technical Perspective*
The chart suggests a potential bullish structure if Tesla holds above the mid‐340s pivot and successfully tests higher resistance levels. Monitoring volume and price reactions around each support/resistance line is key.
*Long‐Term Factors*
Tesla’s share price movements can be quite sensitive to macroeconomic conditions, competition in the EV space, and developments in battery/energy technology. Earnings reports, guidance, and delivery numbers can quickly shift sentiment.
Stock movements depend on numerous unpredictable variables. Thorough research or consultation with a licensed financial advisor is advisable before making any trading or investment decisions. This overview is provided solely for informational purposes.
_Remember that stock movements depend on numerous unpredictable variables. Always conduct your own due diligence or consult with a licensed financial advisor before making trading or investment decisions. This overview is provided solely for informational purposes._

OMH or did we peak at $488? [4hr timeframe idea]OK so I'm going to update this idea over the coming days to give more explanation/hash out some more thoughts, but for now, here is where I'm at.
Here is a bigger picture of the idea, showing previous peaks and how they cycled down (red arrows).
Based on the bottom left example of a Wyckoff pattern found on BTC, we've got one more high before the real downfall cycle begins.
If the top is in (which it could be based on the top left example and us hitting the resistance], the down cycle (red arrow) is already in motion.
I'm leaning towards OMH as it stands, which if the white channel is anything to go by for now, we are looking at $600+ range.
Both are valid ideas IMO, though let me know if you think otherwise/I've missed something :)

Tesla 2-21🔥 Market Overview:
Trend: Bearish; recent bounce but still below major resistance.
Key Levels:
Resistance: $362.00, $366.00.
Support: $353.00, $347.00.
Indicators:
MACD: Weak bearish momentum, potential for a reversal if strength builds.
RSI: 48.31, neutral with slight bullish divergence.
Supertrend: Bearish, but a base is forming.
🔥 Scalping Strategy:
🩸 1. Momentum Scalping
Buy near: $353.50, targeting $358.00 (+1.3%).
Sell near: $362.00, targeting $355.00 (-1.9%).
Stop-loss: Below $351.00.
🩸 2. EMA Pullback Scalping
Buy near: $353.00 (EMA 9), targeting $360.00 (+2.0%).
Sell near: $362.00, targeting $354.00 (-2.2%).
Stop-loss: Below $350.00.
🩸 3. Breakout Scalping
If $362.00 breaks, enter long toward $366.00 (+1.1%).
If $353.00 fails, short toward $347.00 (-1.7%).
🔥 Mid-Term Trend Forecast (1-3 Weeks):
If price reclaims $362.00, expect continuation toward $370+.
If it fails to hold $353.00, a drop toward $347.00 is likely.
The stock remains weak until a confirmed breakout.
🔥 News & Market Context:
Tesla reported 2% revenue growth, missing expectations.
Stock is still under pressure but showing resilience.
Broader EV sector sentiment remains mixed.
🔥 Decision:
🩸 Short-term: Scalping within the $353–$362 range is optimal.
🩸 Mid-term: Tesla remains bearish until a breakout is confirmed.
🩸 Ideal Play: Range-bound trading until a decisive move occurs.
👑 Final Verdict:
Weak stocks bounce before they break. Don’t chase—position with strategy.
🔥 LucanInvestor:
"Discipline in execution separates traders from gamblers. Know the difference."
