BCH/USD Secondary trend. Wedge. Area 96 ArtemisThe graph is logarithmic.Time frame is 3 days. Secondary trend. The wedge is in the final phase of its formation. The price is in its band near the support area of 96. Local double bottom 72% may be formed inside the wedge. Its confirmation and embodiment will bring the price closer to the wedge resistance breakthrough (red line). The price is near the area of historical lows of $77. The price is now $115 Percentage from the key local zones shown on the chart. Remember, the price is now within the wedge band.
Coin in coinmarketcap : Bitcoin Cash
Line chart.
Local trend . Double Bottom Zone.
Main trend was shown earlier in this trading idea.
BCH/USD Main trend. Breakdown of the channel. The important zone
Main Trend. Linear chart.
BCHBEARUSD trade ideas

Bitcoin Cash Spiked: A Surge in Mining Power & Market DynamicsBitcoin Cash ( CRYPTOCAP:BCH ) has witnessed a remarkable surge in value and mining power, signaling a resurgence in interest and confidence within the cryptocurrency community. Despite originating from the same roots as Bitcoin (BTC), BCH has carved its own path, fueled by debates over block size and scalability. Let's delve into the recent developments surrounding Bitcoin Cash, exploring its market dynamics, mining trends, and potential for future growth.
Unprecedented Growth and Market Dynamics:
Bitcoin Cash's ( CRYPTOCAP:BCH ) recent surge, with a staggering 58% increase in value on March 2nd, underscores its resilience and potential for growth. Despite BCH's market capitalization standing at $9.40 billion, significantly lower than Bitcoin's towering $1.20 trillion, the cryptocurrency has exhibited robust momentum, boasting a 78.5% surge in weekly performance. Trading at $479, CRYPTOCAP:BCH is challenging multi-year resistance levels, potentially paving the way for a substantial price spike.
Shift in Mining Preferences:
One of the most notable developments is the surge in Bitcoin Cash's mining power, with an average hashrate jump of 102.5% to 8.01 EH/s as of March 3rd. This surge in mining activity echoes the network's resilience and attractiveness to miners, indicative of its robust security and engagement levels. Unlike Bitcoin's speculative interest, Bitcoin Cash is positioning itself as an efficient medium of exchange, emphasizing scalability and practical utility.
Community Initiatives and Future Prospects:
The Bitcoin Cash ( CRYPTOCAP:BCH ) community is actively championing the cryptocurrency as a global electronic cash system, aligning with evolving market trends. Developers are venturing into decentralized finance (DeFi) and Web3 initiatives, introducing CashTokens to enhance BCH's practical use cases and adoption. With a focus on scalability and utility, Bitcoin Cash ( CRYPTOCAP:BCH ) aims to establish itself as a viable alternative to traditional payment systems, fostering widespread adoption and mainstream acceptance.
Conclusion:
Bitcoin Cash's ( CRYPTOCAP:BCH ) recent surge and resurgence in mining power underscore its resilience and potential for growth in the ever-evolving cryptocurrency landscape. As BCH continues to differentiate itself from Bitcoin and carve its own path, its emphasis on scalability and practical utility positions it as a formidable player in the digital currency ecosystem. With community-driven initiatives and a focus on enhancing adoption, Bitcoin Cash is poised to expand its influence and establish itself as a leading contender in the global electronic cash revolution.


Will the real Bitcoin please stand up.This trade activates at $298 with a stop probably around $255
Most people eat the garbage idea that bitcoin is decentralized, while ignoring or not knowing, that it is a dictatorship by ''Bitcoin Core group''.
No currency is truly decentralized in the decision-making of its design.
Be safe.

Bitcoin Cash Channel Just a theory based on other alts I’ve seen like Solana. Looking for a bottom here around $460 then reversal / pump


Bitcoin Cash levelsBitcoin cash levels to sell / buy.
BCH/USD 1 week chart:
4 year high = 1642
4 year low = 87
VWMA20 = 273
VWMA50 = 235
VWMA100 = 192
VWMA200 = 401
BCH/BTC 1 week chart:
4 year high = .04835
4 year low = .003512
VWMA20 = .007173
VWMA50 = .006728
VWMA100 = .006297
VWMA200 = .013835

BCHUSD Hits Record High: Exercise Caution at Elevated LevelsHello Everyone,
BCHUSD has reached its highest level ever! All indicators suggest that the uptrend will persist, but it's prudent to exercise caution given the elevated levels.
TradeWithTheTrend3344

Bitcoin Cash Surges 40% Ahead of Halving & Jessica Upgrade!In a surprising turn of event, Bitcoin Cash ( CRYPTOCAP:BCH ) soared 40%, driven by anticipation for its halving event and the implementation of an adaptive block size limit algorithm, signaling strong investor confidence and a bullish outlook for the cryptocurrency.
Significant Price Rally as Halving Approaches
Over the week, Bitcoin Cash ( CRYPTOCAP:BCH ) witnessed an impressive surge, surging over 40% to peak at $451. This rally brought its monthly gain to 88%, far outstripping Bitcoin’s ( CRYPTOCAP:BTC ) growth over the same period. Currently, with a market capitalization of $8.71 billion, CRYPTOCAP:BCH is trading around $444, having briefly touched $451. The anticipation surrounding its upcoming halving event, scheduled for around April 1, 2024, and the expected network upgrade in May, has fueled this rapid price increase. Post-halving, the reward for BCH miners will be halved from 6.25 BCH to 3.125 BCH, a change eagerly awaited by the market.
Anticipated Network Upgrades Spark Interest
The Bitcoin Cash ( CRYPTOCAP:BCH ) community is particularly excited about the annual May fork, which aims to implement an adaptive block size limit algorithm. This significant upgrade is designed to address an economic vulnerability that led to the BCH/BTC network split in 2017. According to BCH developer Jason Dreyzehner, the algorithm will adjust the block size limit based on network usage, potentially doubling the maximum block size annually at peak growth. This adaptive approach seeks to balance infrastructure costs with network capacity, ensuring Bitcoin Cash can scale effectively to meet demand.
Market Reaction and Trading Volume Insights
Following this surge, Bitcoin Cash ( CRYPTOCAP:BCH ) now ranks 11th in trading volume among over 10,000 cryptocurrencies. Tether ( CRYPTOCAP:USDT ) is the most traded pair with CRYPTOCAP:BCH , accounting for more than 53% of transactions. Notably, in South Korea, CRYPTOCAP:BCH trades at a premium, averaging $467.75 compared to the global average of $444. This premium highlights the strong demand and positive sentiment towards BCH in specific markets, further emphasizing its global appeal and the widespread anticipation of its forthcoming technical advancements.
The Road to the Jessica Upgrade
As the community eagerly awaits the CRYPTOCAP:BCH Jessica upgrade, excitement continues to build over the adaptive block size limit algorithm. This innovation is seen as a pivotal moment for Bitcoin Cash ( CRYPTOCAP:BCH ), potentially resolving longstanding debates over network throughput and scalability. The previous Cashtokens upgrade in May 2023, which introduced smart contracts and on-chain tokenization, set the stage for this next phase of development, underscoring the CRYPTOCAP:BCH community’s commitment to continuous improvement and innovation.
Conclusion
The remarkable 40% surge in Bitcoin Cash’s value highlights the cryptocurrency’s strong market position and the optimistic outlook from investors and developers alike. With the halving event and the adaptive block size limit upgrade on the horizon, CRYPTOCAP:BCH is set for significant changes that could redefine its utility and scalability.

bitcoin cash vaves update5th vave extension in early stage
currently in vave 2 with .618 retracment
cash spike to 600+ in extended 5th vave setting up
nfa
y axis only

Long Bitcoin Cash (BCH) to $310Trading is slower recently with less than usual decent trade setups. But this looks like a good setup. With VRVP supporting current price with high volume and this coinciding with the bottom of a larger up-trending channel entry here is nearly as good as we can expect. Additionally, our daily RSI is in a fair range.
We do have some resistance to get through. 237 is a level of resistance along with the 100 day SMA just above that. But if those can be defeated, we're well on our way.
Target #1 - 254
Target #2 - 270
Target #3 - 288
Final Target - 311
I plan to take 25 percent off at the first target and raise my SL to break even. Thereafter, every target reached will be another quarter off of my full position and a raised SL to the preceding level.
Risk/Reward on this is a healthy 5/1 with my stop out placed at 222.
Best,
Stew

BCH/USD: Mixed Signals Favor Bullish OutlookHello Everyone,
The BCH/USD situation appears somewhat ambiguous at present. While the trend suggests a bearish scenario, upon closer examination, the bullish perspective seems to hold greater sway. It will be interesting to observe how the support levels hold up in this context.
TradeWithTheTrend3344


BCHUSD Neutral to Bearish Price Action at H1 Time FrameHi there,
The price is neutral over the 268.71 low. A break of this low might encourage more bears, but the price can reverse to test the 280 area.
293.79 and 283.23 highs maintain the bearish momentum in this time frame, and as long as 283.23 is still active over the current price, the overall trend is bearish here.
Happy Trading and have a great weekend
K.

BCHUSDTAfter a long time bch is about to pump.
It's accumulation zone and soon we will see manipulation zone downward then it will go upward.. My first tp is 330.
Just hold it.

BCH/USD: Tracking Support for Bullish ContinuationHello Everyone,
In the BCH/USD pair, our focus is on the weekly and daily pivot points to potentially serve as support at present. Failure of these levels to hold could potentially trigger a bearish pushback.
TradeWithTheTrend3344


BCHUSD Approaching 1-Year High: Long-Term Bullish SentimentHello Everyone,
The BCHUSD pair is nearing its 1-year high of 329.71, indicating a potential resistance level ahead. We are currently monitoring the daily support levels to gauge the market's stability. Despite this, the overall outlook remains bullish for BCHUSD, suggesting long-term growth potential.
TradeWithTheTrend3344

BCH Feb 13th long-term updateAnother week and another free sharing from the TTR most recent #cryptocoin pick update:
Bitcoin Cash is another quite undervalued token. The breakout level sits at 329.50 followed by a main breakout zone resistance at $400-410
I don’t own much of this coin, only 20, but I see great potential here if 1450 is broken to the upside. A test of the 1400-1450 zone will be a big one as it will set a W multi-year pattern and potentially can breakout hard with an upside target of 3225 and ideally above 4.5k
I like the potential here, but I won’t be long if 1450 is not broken to the upside by sometime this year, especially if BTC will be above 90k
There is a clear 4-5x potential here, and I’m fine with holding this token till the 1400 zone exit at minimum.

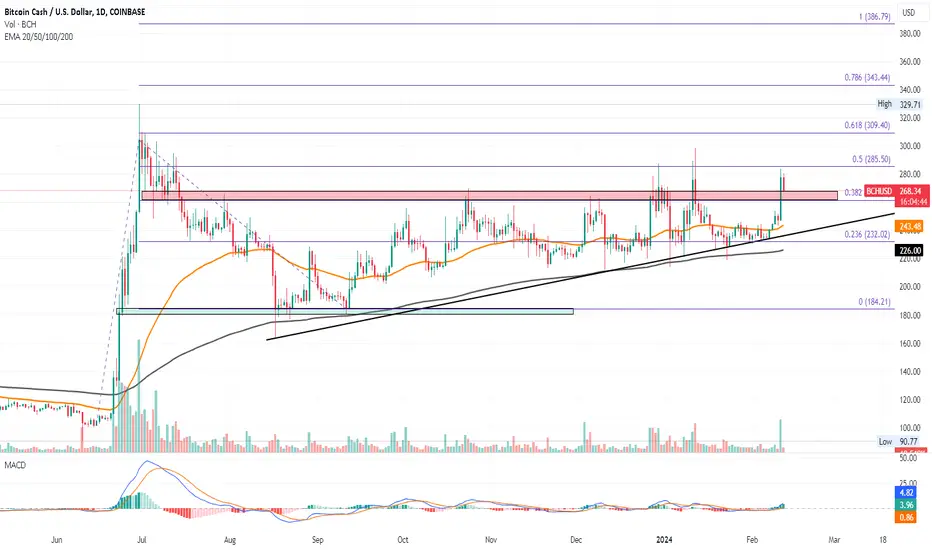
BCH price eyes $350 with this retestRetest Phase of $260 Barrier Breakout: Bitcoin Cash (BCH) is currently in a retest phase following a breakout above the $260 barrier.
12% Jump Challenges $285 Resistance: A significant 12% increase this Sunday challenges the overhead resistance at $285.
Potential to Reach $309: Crossing $285 could propel BCH towards the $309 mark.
Ascending Triangle Breakout: Signals an ascending triangle breakout, indicating potential for uptrend continuation.
Market Momentum Gains: As the market gains momentum, BCH is positioned for a positive trajectory aiming for new 52-week highs.
Influence of Bitcoin’s Bull Run: BCH benefits from the momentum generated by Bitcoin's bull run in its halving year.
Current Trading Price: BCH is trading at $269.53, experiencing a 2.90% intraday fall which serves as a retest of the bullish breakout.
Technical Indicator - MACD: Shows bullish divergence, supporting the breakout rally's continuation.
Potential Surge Influenced by Bitcoin Halving: Anticipated to have a positive impact on BCH and other related coins.
Altcoin Season and BCH’s Performance: With an upcoming altcoin season, BCH has the potential to outperform Bitcoin and possibly reach or exceed $350.
Optimism for BCH to Break $300: The current patterns and market conditions support a strong potential for BCH to surpass the $300 mark soon.

BCHUSDT LONGset your alarm once price get there long from there to the current top of the range.
wait for the best opportunity !

