AMGN Inside bar on daily chartSELL @ 156.27 STOP LOSS @ 159.48 PROFIT TARGET @ 149.85NShortby FabioBiraghiMay 20, 20176
Looking good before earnings.Closing above 164 is a good retrace of 62%. If Earnings call on Cholestrol drug reports promising future, we should see back to 180s soon. Long/Mid/Short nicely reset the oscillators after the last month crash.Nby simbhaApr 25, 20174
AMGN PUTAMGN, PUT when price break 168.74. The first target is 164.75. The second target is 160.40NShortby pointraderSep 1, 20161
shortwe short after close under 152.70 t 139.30 s 159.40 R/R 13:7 NShortby k.alharthi.m.sApr 19, 20174
Down channel toward gap fillpossible hammer daily reversal off the 200dmaNShortby kevin1533Apr 4, 20178
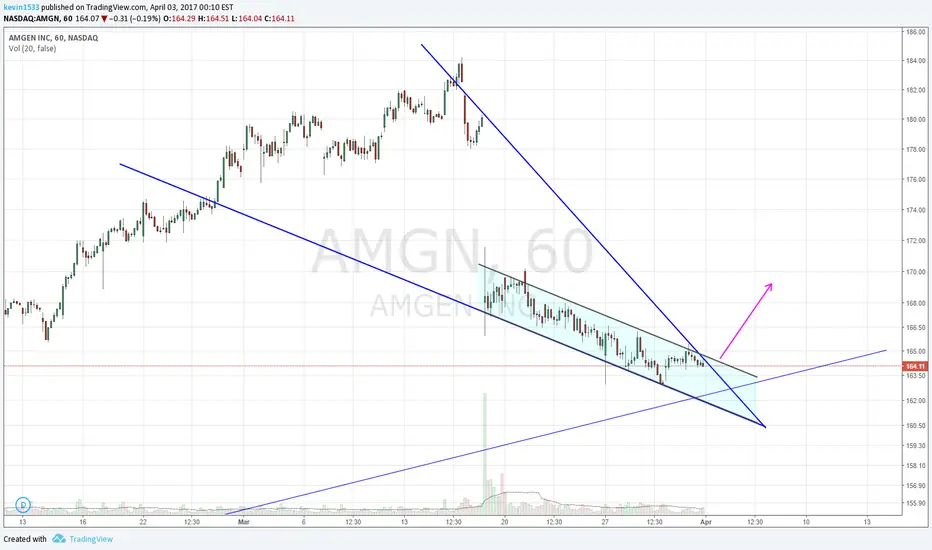
Where Do Investors Buy? $AMGN Crushed On Drug Data And CostShares of Amgen, Inc. (NASDAQ:AMGN) took a thumping today after they announced slightly better data on a cholesterol drug, compared to its peers already on the market. The problem is, the drug costs $15,000 a year and insurance companies will likely not cover the drug because it is only slightly better than what is on the market. The stock dropped over 6% and many investors rushed to buy it. That is a mistake. The stock will continue to trend lower until it hits $160.00, a major support gap fill level. The reasoning is simple. First, investors should never buy a gap lower on negative news from a stock at all-time highs. There will be more trimming of positions in the hedge fund industry and possibly analysts downgrading the stock. In addion, there is no major technical support that is strong enough to justify a buy level. The $160.00 level is major. Buy it there.Nby AnnabelleTraderMar 17, 20177
AMGN / Reversal candlestick (short) ?AMGN / Reversal candlestick (short) ?NShortby FabioBiraghiFeb 23, 20173
Long now or maybe tomorrowHop on Amgen for a little ride up the short-term channel. Not sure if today's bounce will push it up right away, or if it'll wait another day. Good entry point thoughNLongby UnknownUnicorn785485Updated Jan 24, 20171
AMGEN Buying the pullback to demand zone highlighted in yellow. Entry: $152.98 Stop Loss: $151.5 Target: $180NLongby PdunuwilaJan 23, 20174
AMGN RESISTANCE ZONE, WAVE 2 RETRACEGood fundamental. At 145.28 resistance zone, seems like a Wave 2 retracement. Waiting for bullish candle/pennant breakout for Wave 3 confirmation, or resistance zone accumulation for a BUY.Nby happy04tNov 20, 20162
AMGN Bell Curve?AMGN has deviated outside the inner channel into extreme ends of what would be considered to be the sides of bell curve. Short but be cautious. 1st PT around 165 if break then 2nd PT around 144. NShortby TraderMDUpdated Nov 8, 20162
AMGN "correction"As we can see through price action that price is in correction price also formed a flag pattern hence confirming the downward move. strict stop loss at 169. one should also see for some sport at the support zone which is quite strong.NShortby yuvrajsingh7722Updated Oct 17, 2016222
AmgenDemand zone at former resistance on the daily chart. Which should give this level an extra bounce. Entry: $163.82 Stop Loss $161.79 Target1: $170NLongby PdunuwilaUpdated Oct 11, 20162
Confirmed harami signal from resistance lineconfirmed sell signal 1st target 165.09 2nd target about 149 stop at 172NShortby lukatradeSep 20, 20161