Bitcoins Current Weekly Range (With Liquidity Zones) Bitcoins Current Range Explained.
Price Follows Liquidity.
Weekly Range Here.
#BTC #Bitcoin
BITCOIN trade ideas


BTCUSDBullish Leg is amongst us!!!! I hope you'll catch this ride up, as I am!
_SnipeGoat_
_TheeCandleReadingGURU_
#PriceAction #MarketStructure #TechnicalAnalysis #Bearish #Bullish #Bitcoin #Crypto #BTCUSD #Forex #NakedChartReader #ZEROindicators #PreciseLevels #ProperTiming #PerfectDirection #ScalpingTrader #IntradayTrader #DayTrader #SwingTrader #PositionalTrader #HighLevelTrader #MambaMentality #GodMode #UltraInstinct #TheeBibleStrategy

Short Term a small reversal might be cooking here.It seems like 94.5k is a strong point of support (as per today) and I was expecting, for now I will be buying this support area 94.5k and I am expecting a push back to the 99-100k area and if it hold strong and pass resistance of 102k then I will let it ride all the way to 109k and see if it makes another all time high.

BTC update I do see a sell in this market as well we see that after monthly Buyside was taken price moved up and away from range and has taken itself out 4 time on Daily TF and several time on Sellside LQ on Daily TF as well. I can see this going for weekly sellside LQ which is by 60k ish- 67k and then a buy back up.

BTC Long Term IdeaOn the higher timeframe, price is failing to maintain and close above $100k.
We have seen significant pushes from the start of the election in 2024 to inauguration day.
Across the board we have seen bitcoin, alt coins and the crypto market push to new highs due to our first ever crypto supportive/positive presidency.
Before making new highs, revisiting 80,000 USD to 74,000 USD area would be ideal. If we can find support in that area, preferably a weekly closure respecting the highlighted region, that would further my interest in future buys.

BTC Potential Trajectory for next ATH 2025?Hi All, here is my simple take of a possible path BTC can take for the rest of the year - till we hopefully hit another ATH. Ideas based on what I've heard from Steve CCU and others. Big question is how low will we go before we turn back up. S-RSI and MACD show that down trend coming on a weekly timeframe. Maybe we play the daily swings or just HODL hammer through this. Open to thoughts....

BTCUSDT - vomiting camel pattern? then what's next??#BTCUSDT.. market just going to make a technical formation that is VOMITING CAMEL pattern,
that will be a very dangerous formation if its occur.
you can search that formation on google as well.
then next areas are expected like 80000 or 70000
stay sharp
trade wisely


Comprehensive analysis of BitcoinAt present, the 50-day and 200-day moving averages of Bitcoin form a "golden cross", which usually indicates a medium- to long-term bullish trend.
David's suggestion to buy long is reasonable. If you like the following profits, you can buy
Buy: 95600
TP: 95700
TP: 95800
SL: 95555
If you agree with my analysis, please continue to pay attention. I will share my views for free later - (David)
If you don't know which time to trade and want to avoid risks, you can continue to pay attention BITSTAMP:BTCUSD COINBASE:BTCUSD


Comprehensive analysis of Bitcoin (exclusive)Bitcoin is currently in a critical consolidation period. Both technical and fundamental factors point to the approaching change. The short-term trend needs to focus on the choice after the volatility rebounds. If it breaks through $109,000, it will accelerate the rise. If it falls below $91,000, it will cause a correction. However, David believes that the 50-day and 200-day moving averages form a "golden cross", which usually indicates a medium- to long-term bullish trend. In the long run, the price of Bitcoin may continue to rise.
If you agree with my analysis, please keep paying attention. I will share my views for free later-(David). BITSTAMP:BTCUSD COINBASE:BTCUSD BITSTAMP:BTCUSD

Bitcoin (BTC/USD) - 1H Analysis & Prediction📈 Bitcoin (BTC/USD) - 1H Analysis & Prediction
🔹 Key Levels & Market Structure:
✅ 90,268 - 93,326: Strong demand zone, potential for a bullish reversal.
✅ 98,366 - 98,367: Resistance level, key reaction area.
✅ 102,472: Major resistance, breakout level for bullish continuation.
✅ 108,098: Next bullish target if price sustains above 102,472.
🚀 Bullish Scenario:
🔹 If price holds above 90,268 - 93,326, a rally towards 98,366 is possible.
🔹 Confirmation at 93,326 could signal a strong long entry.
🔹 A breakout above 102,472 would confirm strong bullish momentum towards 108,098.
💡 Trading Plan:
✅ Wait for confirmation in the 90,268 - 93,326 demand zone before entering long trades.
✅ Watch price action at 98,366 - 98,367 for potential rejections or breakouts.
✅ Break above 102,472 confirms bullish strength and potential continuation to 108,098.
#fxforever #BTCUSD #SmartMoney #PriceAction #CryptoTrading #LiquidityHunt #Bitcoin

BTCUSD – Key Target ApproachingBTCUSD – Key Target Approaching
Bitcoin has been showing signs of weakness after a sharp rejection from recent highs. Price is now hovering around a key level, and with the current market structure, there's potential for a further dip toward $95,579 before the deadline.
Key Factors:
Market sentiment is cautious after recent volatility.
Some profit-taking could be in play after the latest rally.
If momentum picks up, this level could act as a target before any potential reversal.


AMD MODELAn idea about what is going to happen. since well guys we saw that the market was creating higher highs and lower lows ,and the market went down to sweep the liquidity at the bottom what i am thinking is that the market will create an order block and fair value gap and retest them and go for long up until the higher high on 97, 272.

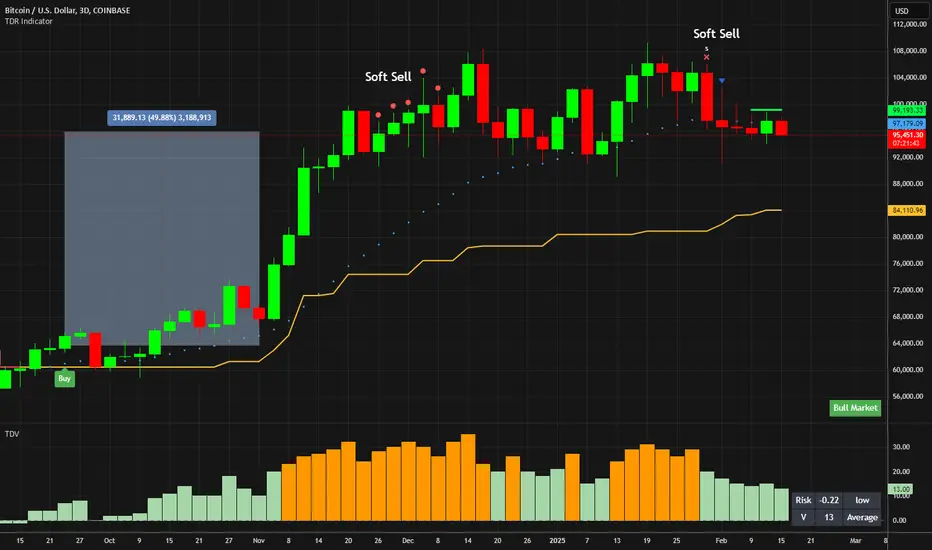
Time to Take Some Profit on Bitcoin.After the previous buy signal in September there has been two soft sell signals on the three day timeframe. Up almost 50% since the last buy signal now is a good time according to the TDR indicator to take some profit. These soft sell signals only signal to off load a small percentage of the position, between 5% and 10% based on your levels of risk.
Bitcoin (scalping + forecast 2-17)Resistance:
🩸 Major Resistance: $98,500 (breaking above unlocks $103,000+).
🩸 Local Resistance: $97,800 (sellers defending this level aggressively).
Support:
🩸 Major Support: $92,500 (if broken, expect $88,500 to be tested).
🩸 Local Support: $94,500 (short-term buyers stepping in).
Indicators:
MACD (2H, 1D): Bearish momentum but flattening—potential reversal setup.
RSI (2H, 1D): Around 45-48, indicating neutral to slight bearish pressure.
EMA 200 (2H, 1D): Acting as dynamic resistance, pushing price lower.
🔥 Scalping Strategy:
🩸 1. Range Scalping (Sideways Trading)
Buy: $94,500 – $96,000, targeting $97,800.
Sell: $97,800 – $98,500, targeting $95,000.
Stop-loss: Below $94,200 (for long), above $98,800 (for short).
🩸 2. Breakout Scalping (Momentum Trading)
Long Entry: Above $98,500, targeting $103,000.
Short Entry: Below $92,500, targeting $88,500.
🩸 3. EMA/VWAP Scalping
If BTC retests EMA 200 and rejects, short with a target at $95,000.
If BTC flips EMA 200 into support, long with a target at $98,500.
🔥 Mid-Term Trend Forecast (1-3 Weeks):
Bullish Scenario: BTC reclaims $98,500, confirming $100,000+ breakout.
Bearish Scenario: BTC loses $92,500, leading to a deeper correction toward $88,500.
🔥 News & Market Context:
Macroeconomics: U.S. inflation concerns could drive volatility.
Institutional Flow: No aggressive accumulation yet—watch for spot buying volume.
Stock Market Correlation: S&P 500 hovering near highs—any risk-off move could impact BTC.
🔥 Decision:
🩸 Short-term: Range trading, waiting for a breakout.
🩸 Mid-term: Watching $98,500 level—long only if confirmed breakout.
🩸 Ideal Play: Scalping inside the range, until confirmation of direction.
👑 Final Verdict:
BTC remains in consolidation mode, with $98,500 acting as a major resistance wall. Scalping opportunities within the range are ideal, while larger moves depend on a breakout confirmation. Patience is key—don't chase weak signals.
🔥 FinCaesar's Quote:
"The market is a battlefield. Only those who strike with precision claim victory." 👑


BTCUSDTrend = Bullish
we will look at the 4 hours timeframe and to me The market is trending up, we broke the High and closed above now the market has pulled back and miss with a few pips in our extreme level then started Trending up.
But also when the market was pulling back we treated a Bearish structure inside this overall Bullish Structure hence i marked as i did to show that the market could be trending up back to test the Extreme level on this inside Bearish structure.
so overall here right now we are stuck on a consolidation trending down but not yet passed this stubborn support that could still take the market back to the Top to that resistance.


BTC. Key moment for the Entire History.After a strong autumn up impulse, Bitcoin price has been moving in an ascending channel for 100 days now. An extremely long consolidation and now the time is coming when the next movement will lay the base for the year trend. Everything will be decided now, here in this ascending parallel channel.
