Btc fibonacci levels BTC has not held 105042 level has fallen down to 100716 level looking like we are heading to 99541 level before a bounce unless we can hold 100000 if your in a short be ready to take profits at levels
BITCOIN trade ideas

BITCOIN OUTLOOKPer my analysis from the support marked being tested, we should now be longing to the 120k mark


btcI don't know why this is in my mind.
If it breaks the green support, first make sure that the break is real and this drawing will be canceled. And be sure to check that the break is not fake
The next topic is the one-hour time frame, which I see as a resistance in the orange line. And maybe it wants to make a similar move like the blue line. This is just an opinion and should not be the basis for your buying and selling.

BTCUSD DailyThe B Boys have decided today that the price will go
From NOW 101449.00———> 100000.
So i will be looking for SELL until it gets to 100000
ImNYRT

Pay attention tho this key level…Currently at range low. 3 scenarios I see from here…
1. Hold the line at 101k area and bounce back to retest top of zone around 105k.
2. Break below, bounce at top of previous wedge top.
3. Free fall to 92k area.
#bitcoin CRYPTOCAP:BTC

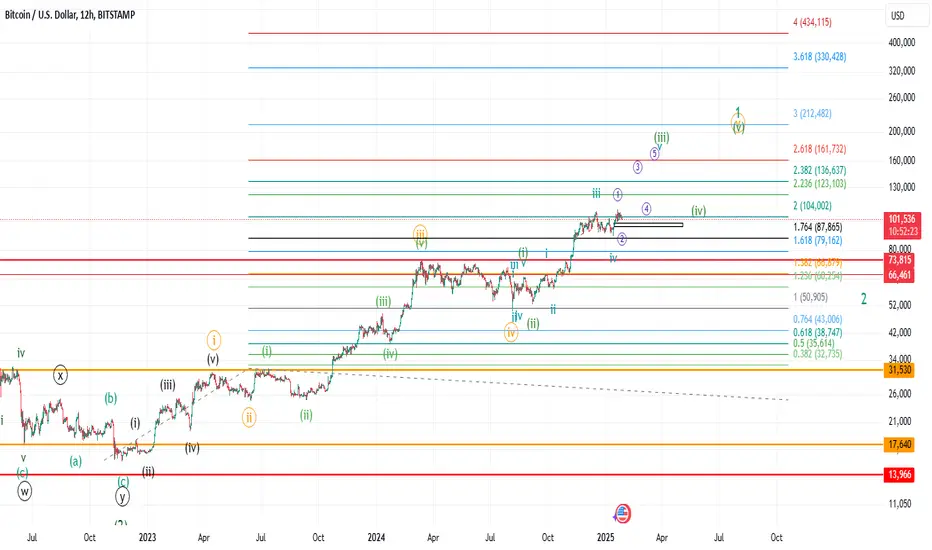
BTC fifth wave extension to finish up the minor degree wave 1So far, BTC is following the extended path to complete wave 5 to end minor degree wave 1. IF price falls below $86k, then I may have to up the internal wave degrees to lower the targets, but even then, the extension target should be 2.618 fib extension of minute degree wave 1 and 2; at $160k. For now, I am watching if $96k support holds for micro degree wave 2. This week will be crucial to get back on the narrative train and start making higher highs. Longer BTC is stuck in this range, greater the probability of distribution cycle and that will not be good for the overall crypto market.
BItcoin ranging looking for a sell setup Price has been ranging from 107k to 102 k.. with rejection happening 3x at that key level and now making minor lower lows and lower highs.. I can see us getting to atleast 105 and possible back to that layer of support at 102k.

BTC, Long, 1Dentry: Current Market Price
take profit: 104,890
stop loss: 99,000
Bitcoin is holding above the critical horizontal support level of 101,850 and remains in an uptrend. The current structure favors a potential upward continuation toward the next target.
LONG 🚀
✅ Like and subscribe to never miss a new analysis! ✅

update on bitcoin sell We got a great drop as expected as the selling pressure showed us during friday it had a minor choch and already took out buyside liquidity.. we are 3/4 to the final target.. Now the next important step is to manage your profits. This is where I would move my stop loss and or take 80% in partials leaving the remaining to run the course. Never let profits turn into a loss. GReat trade to start out the week


BTC is poised...The momentum and price actions is looking very similar to what happened about 2 weeks ago. I've placed the fractal from it and if it plays out close to the same we will have one more quick visit below 100k only to then BLAST OFF and hit close to 120k by the end of January..
Only time will tell!
NFA! God Speed!

The Story of BitCoinSo far within time we have seen this "asset" increase in value and demand.
In a perfect world of mine I would say and tell price to come back to $70,000.00 and then go off again to a new high before everyone uses it and the value goes down to $0.00

CHECK BTC ANALYSIS SIGNAL UPDATE > GO AND READ THE CAPTAINBaddy dears friends 👋🏼
Btc trading signals technical analysis satup👇🏼
I think now btc ready for buy trade btc buy zone enter point (104.800 ) to (104.900)
First tp (105.500)
Last target (106.100)
stop loss (104.000)
Tachincal analysis satup
Fallow risk management

Bitcoin Advisory Report Date: January 26, 2025Bitcoin Advisory Report
Date: January 26, 2025
Prepared for: Investors and Traders
________________________________________
Current Market Overview
Bitcoin (BTC/USD) is trading within a tight consolidation range between $106,250 and $103,600, signalling an indecisive market phase. A breakout beyond this range will determine the next directional move.
• Median Level Support: $100,000 continues to act as a minor support zone, absorbing selling pressure.
• Major Support Level: $75,000 provides a strong foundational level for Bitcoin, expected to prevent deep sell-offs.
• Major Resistance Level: $125,000 remains a significant barrier for bullish momentum.
________________________________________
Technical Analysis
Key Observations:
1. Consolidation Channel:
o Bitcoin is currently oscillating within a defined range of $106,250 (resistance) and $103,600 (support).
o A breakout above $106,250 could lead to a bullish rally toward $108,000 in the short term.
2. Momentum Support Levels:
o Protecting the $104,500 level is critical to maintain bullish momentum for an upward move.
o Failure to hold $104,500 may result in a retest of $103,600 or lower levels.
3. EMA and VWAP:
o The exponential moving averages (EMAs) suggest mixed momentum. The EMA 8 crossing VWAP indicates possible short-term buying pressure if sustained.
4. Volume Analysis:
o The current trading volume is relatively low, which suggests that market participants are awaiting confirmation of a breakout. A rise in volume will be a key indicator of a decisive move.
5. Short-Term Target:
o Based on momentum indicators, if Bitcoin holds $104,500, an upward rally toward $108,000 could be realized by Monday, January 27, 2025.
________________________________________
Fundamental Points
1. Market Sentiment:
o Positive institutional adoption and Bitcoin ETFs have bolstered long-term investor confidence.
o Macroeconomic factors, such as stable interest rates, are supporting risk-on assets like cryptocurrencies.
2. Regulatory Climate:
o Globally, regulatory acceptance for digital assets is increasing, especially with developments in Bitcoin's use in remittance systems.
3. Supply Dynamics:
o Bitcoin's limited supply (halving effects) continues to serve as a bullish catalyst over the medium to long term.
4. Global Economic Factors:
o Inflation concerns have driven investors toward Bitcoin as a hedge, reinforcing its status as digital gold.
________________________________________
Recommendation
Buy Scenario:
• Enter a buy position if Bitcoin decisively breaks $106,250, targeting $108,000 initially, with a stop-loss set at $104,500.
• Consider scaling into positions if price momentum continues upward toward $110,000.
Sell Scenario:
• Consider a short position if Bitcoin breaks $103,600, targeting $101,000, with a stop-loss set at $104,500.
• Prepare for further downside risk toward $100,000 (minor support) and possibly $75,000 (major support) if selling intensifies.
________________________________________
Conclusion
Bitcoin is at a pivotal technical juncture, with the $106,250 to $103,600 range holding the key to short-term price direction. Protecting $104,500 is crucial for bullish momentum, with upside potential toward $108,000. Conversely, failure to maintain support at $103,600 could lead to a bearish retest of lower levels. Investors should watch for volume spikes and breakout confirmations to make informed decisions.
________________________________________

#Short bitcoin As per the analysis am expecting fall in bitcoin till tradline or horizontal line for only short after that I think it will reclaim the trend line and will continue it uptrend one can look for early shorting opportunity at fvg with dollor sign. All this analysis for educational purposes only I will not be liable to your any of loss or profit for that analysis at your own too. Don't trust me tust the God ☝️

BTCUSD Long, January 2025.- Horizontal consolidation, post impulsive bullish move, since late November.
- 92k level defended, with a false breakdown and a 89k wick down on a daily chart
- Pre-breakout structure since January 19, with a top of the triangle at 106k, with a current price at the time of publishing at 104.9k
- Macro picture: bullish trend, postive ETF inflows.
Strategy: playing the upside via BITX (2x BTCUSD)

BTC/USD M15 Cycles Forecast | January 26, 2025This forecast is based on cyclical patterns that aim to identify potential price reversal TIMES only. The indicator does not predict exact price levels or direction of movement.

BTCUSD Next Bullish Leg Up?Bitcoin reached $106860 - previous highs and retraced back to gap for a liquidity grab. Currently seeing some bullish momentum to the upside. Taking a look if it breaks the trendline resistance this time or if it's a false break.

BTCUSD chart Anylisis 4Hour BTCUSD chart Anylisis 4Hour
This is not financial advice trade and manage your own risk

BTCUSD chart Anylisis 1Hour Sideways BTCUSD chart Anylisis 1Hour Sideways
This is not financial advice trade and manage your own risk

BTC - Top around October 2025 - bottom in October 2026I was fooled by the bearish divergence on the 1W-3W charts in thinking that we'd get another correction from these levels. That is still possible, but this overview is based on if we just continue up from these levels.
Our next stops could be 112K, and 127,500K. Maybe we get a correction from those levels.
I think that the BTC top will probably be around 174K - 250K. If all goes as it has in the past, then we probably top around October of this year. Then we would be in a downward bear market until October of 2026, where the bottom will probably be around 80% from wherever we top.
Also, we do appear to be doing a classic Elliot Wave 5 wave structure, so we may do a big ABC type move downward into October of 2026.

BTC forming an ascending triangle
As it stands, the next significant buy wall has moved down to 103k. I am finding this on a depth chart. This aligns with an upward trend BTC has been holding, placing it's next significant level of support right on it's current trend line. Ignoring the extra volatility spike on the 20th of Jan, the resistance to break is 107K, which as it stands, has less selling pressure than buying pressure found at 103K. This would fall in line with the formation of an ascending triangle, and an expected break to the upside past 107K. If this happens, there is an extreme amount of selling liquidity at the 108k level, if a mass amount of orders are liquidated, that will accelerate the move.
Using the triangle for profit targets, this move would place BTC near the 115K level once broken successfully. However if this does play out, I would expect FOMO to push well past this level.
Fundamentally this is playing out with the introduction of a crypto friendly American government, and all the good fundamental news we've been hearing.
