AI Trading BOT Long BTC/USD signalAI Trading BOT Long BTC/USD signal
Technical indicators (e.g. RSI, MACD, SMA)
Historical data and trend analysis
Prediction based on machine learning algorithms
BITCOIN trade ideas

BTC BearsYesterday's bears cancelled out the buying during the weekend and the crypto reserve news from Trump. Makes sense for another leg down..either a sell position from around 86,200 with a stop loss around 87,000 or if it breaks below 83,015 with a stop loss at 84,800 with 82,500 as a watch zone. target will be 80,700 followed by 79,200.

Every cloud has a silver lining—crypto is no exceptionHello everyone!
What a week it has been, right? Haha! For those feeling frustrated by the market, remember this: you're paying for a lesson. The market—especially the crypto market—doesn’t care about individual retail traders. It’s not actively trying to make you lose, but it does present opportunities. As a trader, you can either navigate these trends with a thoughtful approach—calculating your risk, setting stop-losses, and defining your targets—or you can gamble and hope for the best, like most retail traders do. If you choose the latter, the big players will outmaneuver you, making you sell at the bottom and buy at the peaks.
Rough picture
Regarding my analysis, this isn't my usual deep dive across all timeframes. I’ll be honest—I haven’t thoroughly analyzed everything. However, given the current market conditions and the high fear and greed index, I decided to share my rough thoughts. Even in their raw form, they still represent my current bias.
Monthly Timeframe (6M-3M-1M)
The larger timeframes dictate the overall market picture. We’ve clearly taken out the previous monthly candle and a key yellow zone below us, signaling that liquidity is still up for grabs. Combined with the fear and greed index, this suggests there’s still room for downside movement. Additionally, the price hitting the 0.61 extension indicated potential for a reversal (which has already occurred), giving us an opportunity to look lower.
Weekly & Daily Timeframes
The weekly chart gives more clarity on how far this move might extend. I typically mark previous closed candles with two yellow dotted lines, indicating liquidity is still available above or below those levels. Since we are currently in a daily downtrend and have just hit the 0.786 retracement (from 78K to 95K), it’s likely that we’ll complete this waveform towards the 0.21 - 0.61 region. This aligns with our "X marks the spot" zone on the weekly timeframe, somewhere between 0.618 - 0.786.
Many traders bought near the top and now hesitate to buy at the lows while sitting on red numbers. The truth is, if you enter the market without a plan, the market will make one for you—and most of the time, you won’t like it. You’re not just playing against yourself; you’re competing against major players who are obsessed with making money in this game, while you are simply the bait.
My Game Plan
I’ll risk around 3-5% on this trade to the upside, with a mandatory stop-loss to limit any major losses.
I’ll take partial profits along the way up.
I’m primarily scaling into altcoins this round, as I believe the percentage gains there are more attractive compared to BTC at the moment.
Have a safe flight in crypto! 🚀

BTC Daily Forecast until June 2025BTС will move down in the channel to the support level in the area of 70-75. Then a sideways corridor with a resistance level of 90-95 and support of 70-75.

Bearish BTCOn the daily and weekly stochastic RSI is in the overbought zone.
Using fibonacci, on the daily, price has not finished out the fib sequence to the d extension and had less than a 38.2 pullback.
We hit a d extension on the monthly.
Still bearish on this pair at least to 77K = 38.2 up fib retracement zone with inclination toward further downside potential to 68K = 61.8 up fib retracement zone.

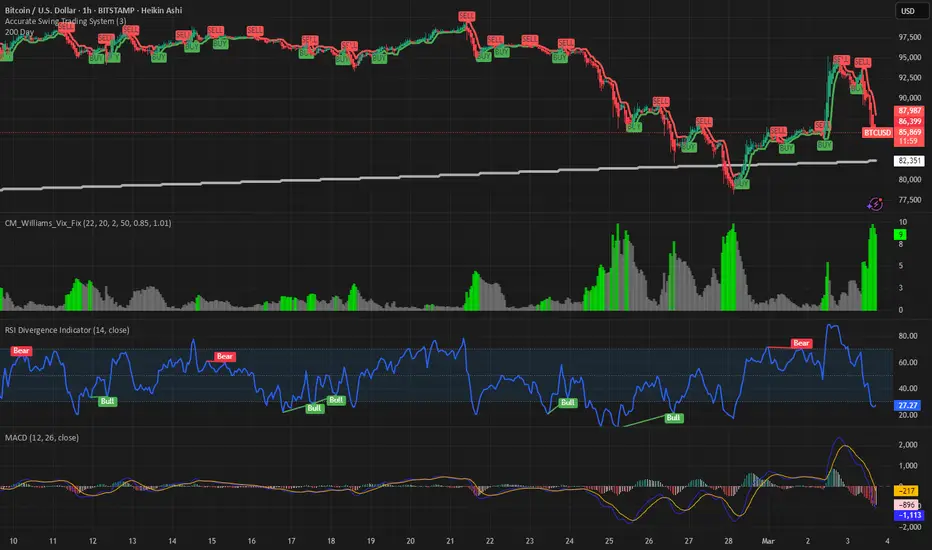
BTC support level - break or bounce?BTCUSD on the 1D chart is sitting at 200DMA line. It first broke through on Feb 28, 2025 and closed above. Weekend news on crypto reserve from President Trump generated a quick pump and dump.
As of late day March 3, it touched the 200DMA again and has held above.
Next move:
On a break, next major support is around 72870.
On a bounce, target at congestion zone between 96000 to 100000, with significant ceiling from the 50 and 100DMA at 97000 and declining.
Market-moving fundamental news can be expected around the U.S.crypto summit on March 7th. BTC may be (relatively) range-bound until then.

$BTC Bear market has startedBitcoin is facing multiple headwinds that make it a strong short opportunity. First, liquidity is tightening as the Fed maintains higher interest rates, reducing risk appetite. Second, Bitcoin’s recent rally has been largely fueled by ETF inflows, but momentum is slowing, and profit-taking could trigger a sharp correction. Third, regulatory pressures continue to mount, with governments increasing scrutiny on crypto markets. Finally, technical indicators show overbought conditions, increasing the risk of a pullback. With potential downside volatility and weak fundamentals in the short term, now could be the ideal time to bet against Bitcoin before the next major drop.
InverseTomPip

BTCUSD-NEUTRAL LARGE RANGE 6 Hourly chartYesterday, technically it felt we may see little higher, but overall down. Surprise, surprise large down move again and it means the over all pattern seems to be a S/H/S top and this could bring us much lower than current levels even. Somewhere $ 60k overall.. anyway, I remain the viewpoint, that crypto is a manipulative asset class.
Strategy trade range, but SELL $ 88-95k range but get out above $ 109 k somewhere. I think profit somewhere $ 65k for now.

Bitcoin Bearish Outlook: Confirmed BreakdownBitcoin Bearish Outlook: Confirmed Breakdown Signals Extended Correction
Bitcoin (BTC/USD) has shifted into a full on bearish outlook following the February monthly close below $84,400. A large-scale bear cycle is now unfolding, with the next key support at $73,781, marking a significant Fibonacci correction. Read on for key insights and updated targets.
Bitcoin (BTC) has officially entered a bearish phase after its February monthly close dropped below the crucial $84,400 key support level. This breakdown serves as a major technical confirmation that the bullish structure has failed, paving the way for a broader downside correction. With selling pressure intensifying, Bitcoin now faces the risk of a deeper pullback toward the next key support zone.
As of today , Bitcoin (BTC/USD) is trading at $86,250, remaining under sustained bearish control. The next critical downside target is $73,781, a level derived from the 38.2% Fibonacci retracement, marking a significant profit target for this updated bearish forecast. A stop-loss level is suggested around $95,937, which aligns with a key resistance level from the latest price action.
Bitcoin Technology, Vision, and Mission
Despite its current market downturn, Bitcoin remains the dominant force in the cryptocurrency space. As the first decentralized digital asset, its mission is to redefine global finance by offering an alternative, trustless monetary system. While its price is experiencing a correction, Bitcoin’s adoption among institutions, payment networks, and sovereign nations continues to grow, reinforcing its long-term value proposition.
Bitcoin’s vision remains intact—to become the ultimate decentralized store of value and medium of exchange. Layer 2 solutions, such as the Lightning Network, continue to enhance Bitcoin’s scalability, ensuring its role in the evolving financial landscape.
Fundamental Catalysts
Major Support Breakdown: The monthly close below $84,400 is a key bearish signal, triggering further downside risk.
Extended Bear Cycle Confirmation: Bitcoin is now experiencing a large-scale technical correction, targeting $73,781 as the next major support level.
Market Sentiment Shifts Bearish: With increased selling pressure, traders and institutions are adjusting their positioning to reflect the new market reality.
Key Price Levels
Previous Support (Broken): $84,400
Next Major Support: $73,781 (38.2% Fibonacci retracement)
Stop-Loss Level: $95,937
Bearish Profit Target: $73,781
Looking ahead, Bitcoin’s inability to reclaim key resistance levels suggests that selling momentum will likely persist. As long as $84,400 remains unchallenged, the bearish outlook remains dominant. The next test at $73,781 will determine whether a larger-scale correction is in play. Traders should closely monitor price action for confirmation of further downside or signs of stabilization at this critical level.

$BTC/USDT Market Update📊 $BTC/USDT Market Update
Welcome to today's analysis! Let's take a look at Bitcoin ( CRYPTOCAP:BTC ) and its key resistance level.
🌐 Overview: CRYPTOCAP:BTC Testing Key Resistance
📈 CRYPTOCAP:BTC is approaching the red resistance zone around $88,500, a critical level that needs to be broken for further upside.
🔄 Current Scenario:
CRYPTOCAP:BTC is facing strong resistance at $88,500, where sellers have previously stepped in.
A breakout above this level could trigger further bullish momentum.
🔑 Key Levels to Watch
🔴 Resistance Zone: $88,500 (Needs breakout for continuation)
🛠️ Trade Scenarios
📌 Bullish Scenario (Breakout Above $88,500)
If CRYPTOCAP:BTC breaks and holds above $88,500, it could confirm bullish momentum and lead to higher targets.
A breakout with strong volume would signal further upside potential.
📌 Bearish Scenario (Rejection at Resistance)
If CRYPTOCAP:BTC fails to break above $88,500, we might see a pullback or consolidation before another attempt.
A rejection could indicate that sellers are still in control at this level.
📌 Conclusion
CRYPTOCAP:BTC is at a crucial resistance zone—a breakout above $88,500 could lead to a strong rally, while failure to break may result in another pullback.

Bitcoin moon chartWe are still in the correct moon quadrant. all the FUD and volatility that was unleashed on those still invested was not enough to get out of where it is supposed to be

WhewwwwwThis is why I swing trade crypto on the 1 hour or 4 hour time frame, sooooooo juicy. Stay close to the exit, if you have to refresh not a big deal. Holding this stuff is such garbage since there really is no underlying physical value or physical price discovery. Now I get it, there is Tesla fanboys as well. Doesn't make it smart money. Being a trader is farrrrr more profitable than an investor. People fall in love too fast and too quick. Learn to separate yourself from the rest of the flock. Don't be greedy and you will be well on your way to being an excellent and profitable trader. Have a great night everyone! Happy trading!
Today's forecast on Bitcoin"Negative energy: 9:30-23:30 UTC ; Peak energy: 14:00, 18:30"
Today's forecast on Bitcoin, along with the Saturn System price pivots which I keep giving out of good intentions for anyone who has ears to listen.

BTCUSD BUY ANALYSIS SMART MONEY CONCEPTHere on BTCUSD price form a demand around area of 83070 and is likely to continue moving up so trader should go for long with expect profit target of 89617 and 97323 . Use money management

BTC CHARTS PATTERN WILL RISE AGAIN Current Trend: The current trend is neutral.
Conclusion: The market currently has a neutral sentiment, with a moderate confidence level. There is a need for closer examination of support and resistance levels to confirm the trend.
lets wait see what could be the next scenario may be something bullish trend

BTC - looking to short and daily correctionHello traders, please feel free to share your trading ideas, and please give a Boost if you agree with my trading plan. My trading strategy is Price Action, which is the simplest strategy of trading on the price movement. A key part of my discipline is Stop Loss set when opening a trading position, which ensures every trading is risk managed. My 1 to 1 trading training is available, please message. Trade well and good luck!

Gold Playing out as plannedOur weekend analysis is playing out as planned. We look forward to resume selling on Gold once our entry criterion is met.
Once we get the crossover of the MAs on 15 mins we will commence the sell

A simple FIB CHANNEL FOR BTCTitle Says it all.
Trade between the levels.
just as you trading inside channels.
Gann Methods Master them all..:

BTC shortThe very unexpected bounce on sunday led to big hopeium that the crypto party is not over. My short term algos all pointing to the downside though.. are we trapped ?

BTCUSD Trading Breakdown: Turning Analysis into ActionHello, crypto enthusiasts! Let's jump into a vibrant exploration of the BTCUSD market using our trusty 2-hour Heikin Ashi charts. Ready to decode Bitcoin’s twists and turns for our trading edge? Let’s go! 📉📈
Strategic Mapping 🗺️
Our chart is a treasure map, showing us key battlegrounds where significant trading has taken place. The volume profile acts as our X marks the spot, with the Point of Control (POC) highlighting the busiest trading zone. This is where the action happens, and it’s central to our trading decisions.
Navigating with Market Cipher B 🔮
Market Cipher B is our crystal ball. This indicator doesn’t just show us where the market’s been; it predicts where it's going. It highlights buy and sell opportunities with an array of peaks, valleys, and vibrant waves of momentum. It’s our secret weapon for staying one step ahead in the market.
Executing Our Strategy ⚔️
Keep an eye on the 0.786 Fibonacci level; it’s more than just a line on a chart. It’s given us a solid short opportunity already, and if prices head back that way, we’re ready to strike again. This is where theory meets practice, and we’re here to make it profitable.
Caution Ahead! ⚠️
Venturing back into trades at mid-range is like walking into a minefield. It’s risky, unpredictable, and not for the faint of heart. Precision is key. It’s not just about trading; it’s about trading smart.
Looking Forward 🔍
Should our upward trek revisit the upper zone, we’ll be hunting for signs of bearish divergence and cooling money flows. These clues could signal another prime shorting shot. We’re not just reacting; we’re anticipating, ready to capitalize on what comes next.
This isn’t just chart analysis; it’s a strategic playbook. With our charts, our indicators, and our savvy, we’re not just trading; we’re aiming to conquer. Let’s stay sharp, make informed moves, and ride the crypto wave to success. Here’s to trading smarter, not harder! 💪📊

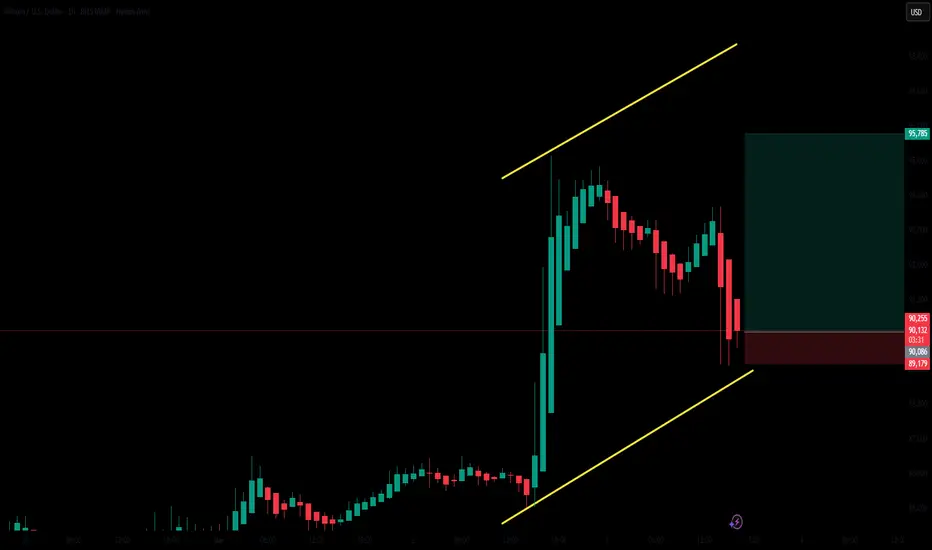
Bullish move on the 1 hour chart?There might be a possible bullish move on the 1 hour chart before a deep fall.
Stop loss: 89k
Took out the low of the highest bar on monthly - 50 k This channel is not providing individualized trading or investment advice, nor is it a banking service, brokerage service, trading service, investment service or money management
service.

