GDX trade ideas


Stay long GDX gold minersSimilar to the patterns playing out elsewhere, the "inflation trade" is still supportive of hard assets (and miners). GDX has had a nice pullback into 38% and move ave support. I've been long for quite a long time but those looking to get some exposure can use this as an opportunity.
Long 34, Stop 32, Trgt 40
Return/Risk = 3:1

GDX - Gold Miners ETF: Inverse Head & shouldersGold prices have surged to unprecedented levels in light of recent trade policy changes. The announcement by US President Donald Trump regarding a new 25% tariff on essential imports such as cars, semiconductors, and pharmaceuticals has created a wave of uncertainty among investors. This risk-off sentiment has driven many to seek refuge in safe-haven assets like gold.
Nevertheless, this upward momentum may encounter challenges if a trade agreement with China comes to fruition. A successful deal could alleviate global trade tensions, leading to a decrease in gold demand and possibly resulting in selling pressure.
However sustained high bullion prices could prove to be a significant advantage for gold miners. The GDX ETF is showing a persistent inverse head and shoulders pattern, indicating potential for further gains.

Elliott Wave View: Gold Miners ETF (GDX) Impulse Rally ProgressShort Term Elliott Wave View in Gold Miners ETF (GDX) suggests rally from 12.30.2024 low is in progress as an impulse. Up from 12.30.2024 low, wave 1 ended at 38.2 and dips in wave 2 ended at 36.84. Internal subdivision of wave 2 unfolded as a zigzag Elliott Wave structure. Down from wave 1, wave ((a)) ended at 37.31 and wave ((b)) ended at 37.95. Wave ((c)) lower ended at 36.83 which completed wave 2 in higher degree.
The ETF has extended higher in wave 3 with subdivision as a 5 waves with extension (a nesting impulse). Up from wave 2, wave ((i)) ended at 38.16 and pullback in wave ((ii)) ended at 36.84. The ETF extended higher in wave (i) towards 39.73 and pullback in wave (ii) ended at 38.14. Up from there, wave i ended at 39.92 and wave ii ended at 39.24. Wave iii higher ended at 41.53 and pullback in wave iv ended at 40.80. Expect the ETF to end wave v of (iii), then it should pullback in wave (iv) before higher again. Near term, pullback should find support in 3, 7, or 11 swing against 36.83 low for further upside.

Opening (IRA): GDX Dec 20th 36 Covered Call... for a 35.29 debit.
Comments: Selling the -75 delta call against stock to emulate the delta metrics of a 25 delta short put, but with the built-in defense of the short call.
Metrics:
Buying Power Effect/Break Even: 35.29/share
Max Profit: .71
ROC at Max: 2.01%
50% Max: .36
ROC at 50% Max: 1.00%
That 1.00% ROC at 50% max is kind of "marginal," but just trying to keep theta on and burning with little stuff that I can add to should I have the opportunity to get in in higher IV/weakness.

Opening (IRA): GDX January 17th 34 Covered Call... for a 33.28 debit.
Comments: Selling the -75 delta call against stock to emulate the delta metrics of a 25 delta short put, but with the built-in defense of the short call. Adding at strikes/break evens better than what I currently have on. This puppy also happens to have a dividend on offer in December, but is quite variant: www.nasdaq.com
Metrics:
Buying Power Effect/Break Even: 33.28
Max Profit: .72
ROC at Max: 2.16%
50% Max: .36
ROC at 50% Max: 1.08%


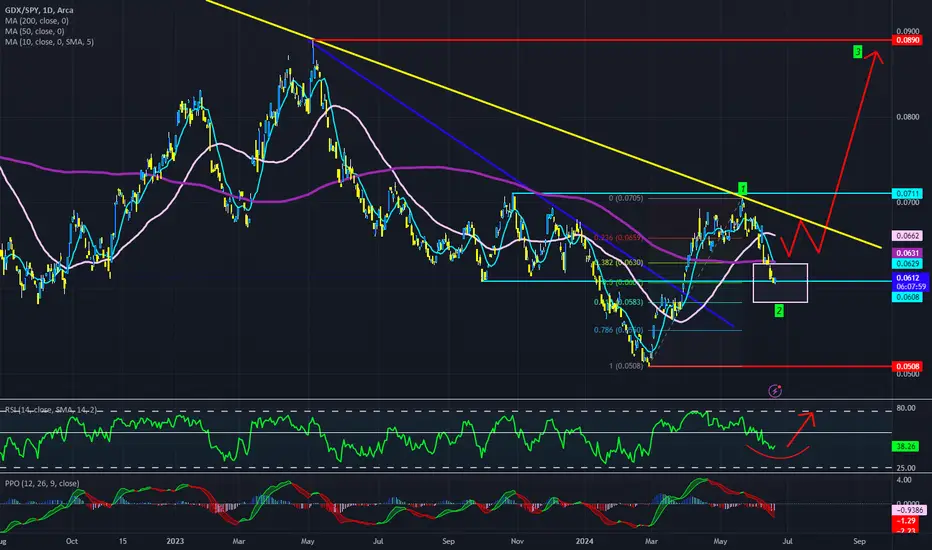
My Watchlist: GDXGDX, I have a green setup signal(dot Indictor). It has an excellent risk-to-reward ratio(RR:). I'm looking to enter long near the close of the day if the stock can manage to TRADE above the last candle highs(white line). If triggered, I will then place a stop-loss below(red line) and a price target above it(green line).
********
Note: The above setups will remain valid until the stock CLOSES BELOW my set stop-loss level.

Elliott Wave View on GDX Favors Pullback Before RallShort Term Elliott Wave View in GDX suggests the zigzag correction should find support towards extreme areas before resume higher to finish the impulse sequence from 5-August, 2024 low. It is showing higher high sequence in daily from September-2022 low and expect short term rally to continue against August-2024 low. Since 5-August, 2024 low, it placed 1 at 39.97 high and 2 correction at 36.22 low as 0.618 Fibonacci retracement. Above 36.22 low, it placed ((i)) of 3 at 36.89 high, ((ii)) at 36.44 low, ((iii)) as extended wave at 40.98 high, ((iv)) at 39.02 low and finally ((v)) as 3 at 42.12 high.
Below 3 high, it favors zigzag correction in 4 against 6-September, 2024 low before resume higher. Below 42.12 high, it favors pullback in ((c)) of 4 started from 40.79 high. It placed ((a)) of 4 at 39.35 low as 5 swing sequence, while placed ((b)) at 40.79 high. Within ((a)), it placed (i) at 41.22 low, (ii) at 41.95 high, (iii) at 39.96 low, (iv) at 40.75 high and (v) as ((a)) at 39.35 high. Below ((b)) high, it placed (i) at 39.12 low and (ii) at 40.19 high. Currently, it favors lower in (iii) and expect short term weakness towards 38.03 or lower levels to finish zigzag before resume higher in 5 as possible diagonal from August-2024 low.

Opening (IRA): GDX Oct 18th 32/37/37/42 Iron Fly... for a 2.66 credit.
Comments: High IVR/High IV (59.8/35.2). Some more "little stuff" in that 45 DTE wheelhouse while I wait for other things to come in or require management.
Metrics:
Max Profit: 2.66
Buying Power Effect: 2.34
ROC at Max: 113.68%
25% Max: .67
ROC at 25% Max: 25.19%

Elliott Wave View on Gold Miners ETF (GDX) Expects Continuation Short term Elliott Wave view on Gold Miners ETF (GDX) suggests that decline to 33.86 ended wave (4). The ETF has turned higher in wave (5). Internal subdivision of wave (5) is unfolding as a 5 waves impulse Elliott Wave structure. Up from wave (4), wave ((i)) ended at 36.25 and dips in wave ((ii)) ended at 34.54. The Index extended higher in wave ((iii)) towards 38.08 and pullback in wave ((iv)) ended at 36.56. Final leg wave ((v)) ended at 39.97 which completed wave 1 in higher degree.
The ETF then pullback in wave 2 with internal subdivision as a zigzag Elliott Wave structure. Down from wave 1, wave ((a)) ended at 38.54 and wave ((b)) rally ended at 39.77.Down from wave ((b)), wave (i) ended at 38.04 and wave (ii) ended at 39.15. Wave (iii) lower ended at 36.7 and wave (iv) ended at 37.83. Wave (v) lower ended at 36.22 which completed wave ((c)) of 2 in higher degree. The ETF has turned higher in wave 3. Up from wave 2, wave (i) ended at 37.48 and wave (ii) pullback ended at 36.49. Near term, as far as pivot at 33.86 low stays intact, expect pullback to find buyers in 3, 7, or 11 swing for further upside.


Elliott Wave Intraday Analysis Looking for GDX to Extend HigherRally from 9.26.2022 low in AMEX:GDX is currently in progress as a 5 waves diagonal. Up from 9.26.2022 low, wave (1) ended at 36.26 and pullback in wave (2) ended at 25.62. The ETF then extended higher in wave (3) towards 39.4 and pullback in wave (4) ended at 33.85 as the 1 hour chart below shows. Internal subdivision of wave (4) unfolded as a double three Elliott Wave structure. Down from wave (3), wave W ended at 35.9 and wave X ended at 38.22. Wave Y lower ended at 33.85 which completed wave (4) in higher degree.
The ETF then turns higher again in wave (5). Up from wave (4), wave ((i)) ended at 36.25 and wave ((ii)) pullback ended at 34.54. Wave ((iii)) higher ended at 38.08 and pullback in wave ((iv)) ended at 36.56. Expect wave ((v)) to complete soon which should also end wave 1 in higher degree. Afterwards, it should pullback in wave 2 to correct cycle from 8.5.2024 low in 3, 7, or 11 swing before the ETF resumes higher again. Near term, expect pullback to find support in 3, 7, 11 swing against 33.85 for further upside.


Gold will underperform over the next 30+ daysDon't think there's good value in precious metals, right now. It'll likely under perform against oil and indices over the next 30 days. In all likelihood, investor are rotating out of the gold position and will continue to do so in the coming weeks. A better choice would be oil than precious metals.


Elliott Wave Expects Gold Miners ETF (GDX) to Continue RallyShort Term Elliott Wave View in Gold Miners Junior (GDX) shows that cycle from 10.4.2023 low is in progress as a 5 waves impulse Elliott Wave structure. Up from 10.4.2023 low, wave 1 ended at 32.35 and pullback in wave 2 ended at 25.67. Wave 3 higher ended at 37.47 and dips in wave 4 ended at 32.83 like the 1 hour chart below shows. The ETF has turned higher in wave 5 with internal subdivision as another impulse in lesser degree.
Up from wave 4, wave i ended at 33.35 and wave ii ended at 32.98. Wave iii higher ended at 34.79 and pullback in wave iv ended at 34.35. Final wave v higher ended at 34.83 which completed wave (i) in higher degree. Wave (ii) dips unfolded as a zigzag Elliott Wave structure. Down from wave (ii), wave a ended at 33.8 and wave b ended at 34.58. Wave c lower ended at 33.28 which completed wave (ii). The ETF has rallied higher again. Up from wave (ii), wave i ended at 34.63 and wave ii ended at 33.65.
Wave iii higher ended at 36.53, and dips in wave iv ended at 35.51. Expect wave v to end soon which should complete wave (iii). Afterwards, it should pullback in wave (iv) to correct cycle from 6.26.2024 low before it resumes higher again. Near term, as far as pivot at 32.83 low stays intact, expect pullback to find support in 3, 7, 11 swing for more upside.