GS trade ideas


12.5.17 | GS | Day | Andrew AponasJournal Entry: It looks like price is making it's second attempt to break through a historical price ceiling. However the last two tests of this price ceiling have happened within a short time period of each other relative to this stocks behavior (I will include the detail below). This is an indication that price is getting ready to break through this price ceiling and begin a new rally to set all time highs, meaning this stock will begin to trade for high's it has never seen before. Over the past 6 months price has been trading in a sideways moving channel directly below this price ceiling, and has just recently began it's breakout to test it again. Moving through the ceiling is another major price level to break, a monthly supply line. A close above the supply line and price ceiling is going to be a strong indication that this stock is going to rally without looking back. I have my first target set at $260.30 drawn as an orange line with a blue target. Price right now may be forming a potential/possible bullish flag, which is validated by the declining volume and anomalies over the past three trading sessions. So far there has been only a few odd balls in the group of financials; GS is one and JPM is another. I think once these stocks show clear indication of a rally, the rest will have less resistance to trade to a higher level. Thank You, God Bless.
Indicators:
MACD has just made a major pivot below the 0 line and is still very bullish with wide spacing in the lines and bot still angled upwards. A bullish continuation in the histogram will be another strong indication of a bullish continuation.
OBV I will display the detail in an updated image below please see the detail for the narrative.


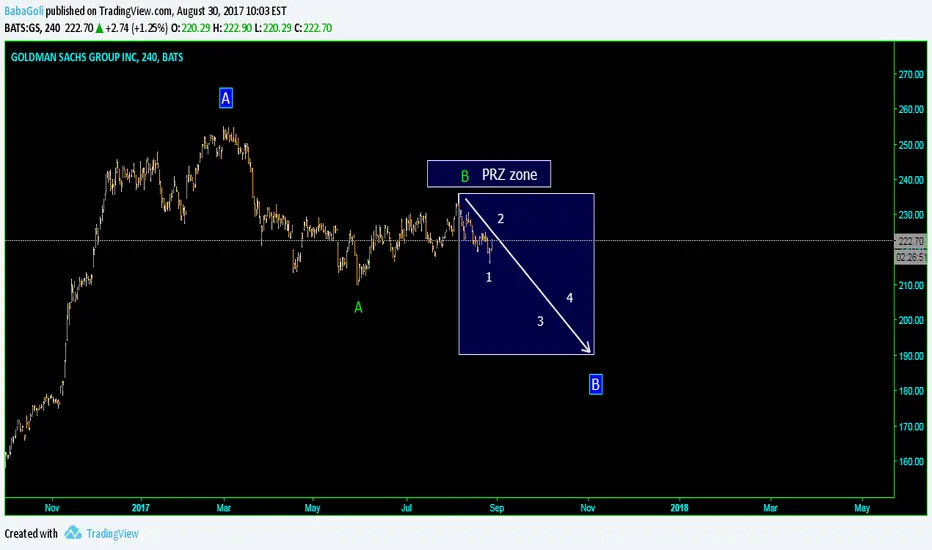
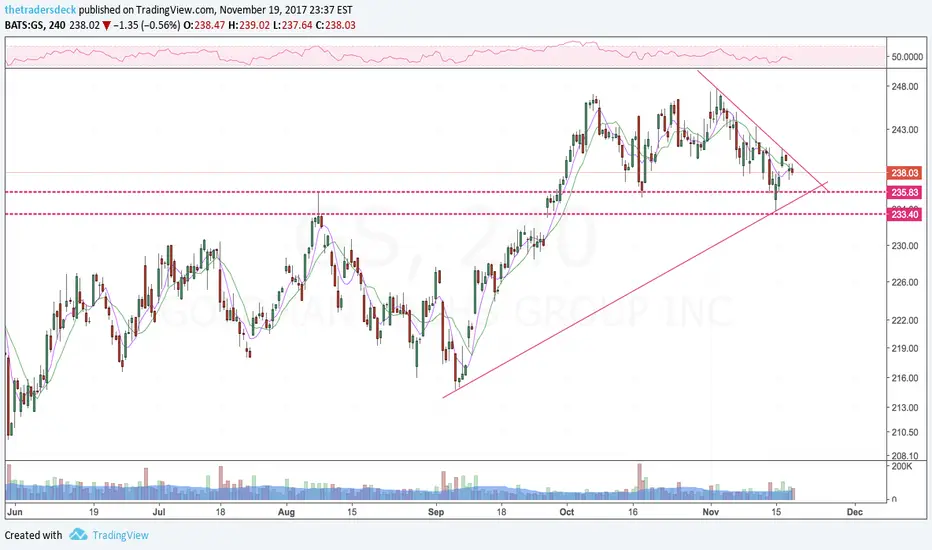
nyse: $GS Short plan for the week of 11/20/17Channel Down identified. This pattern is still in the process of forming b. Possible bearish price movement towards the support 233.55 within the next 2 days.
Supported by bearish Exponitial Moving Average cross on 4hr time frame


GS inside day after earningsGS has a inside day after earnings, and it's one of my favorite trade!
The stock futures had a little bit plunge this afternoon as the news about Spain, while in terms of inside day, we won't be afraid of news.
What we focus on more is the direction it breaks.
If it's able to break to the upside, it means it shows great relative strength and it's still a nice long; If it breaks to the downside, then it will pretty much be a short-term trade as I am not bearish with the stocks yet.
Also, there is a potential bat pattern entry
I drew this kind of pattern several times as it can give different strategy depending on different kinds of scenario, so I have a clear mindset to deal with the unpredictable market movement.

Tombstone doji & Long day (black or red)on max chart and YTD charts respectively | near resistance and all-time high| both alluding to bearish to extreme bearish reversal | PUT LEAP


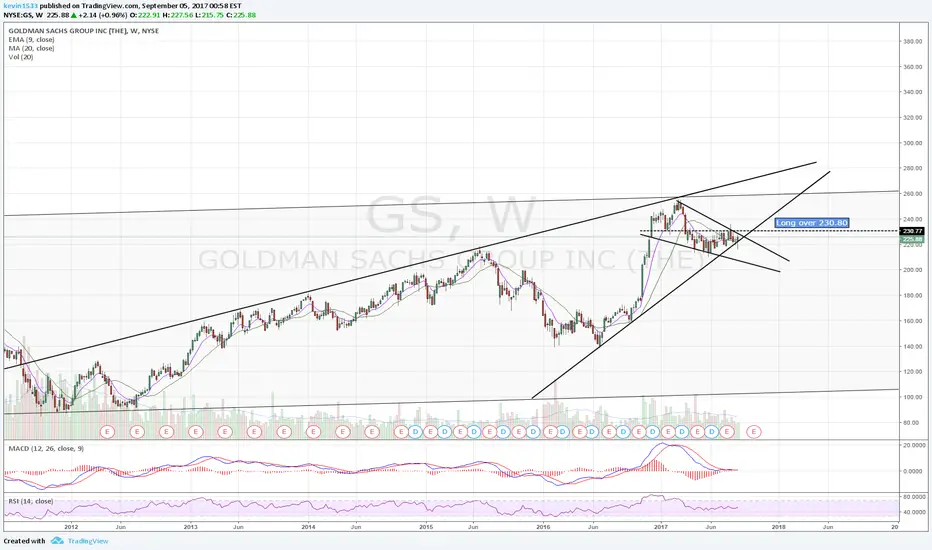
Goldman Sachs: QuestionableThe current consolidation occurs with in the primary uptrend. Normally we would be quite bullish on such a stock, but the current flat correction is taking too long for comfort. Earlier attempts to make a push higher have not succeeded and the lack of demand while the broader market is flirting with new highs does not match the trend phase.
With considerable scepticism and caution we look to the upside as long as 210 holds as critical support. Buying is only justifiable when the trigger at 230.90 is taken out. Target then comes in at 264.50 with 250 being intermediate resistance.

Nice update on GSHIt my target now waiting to get out on MONDAY some nice gains, can let it ride
upwards towards 2nd targt but might not do that .....