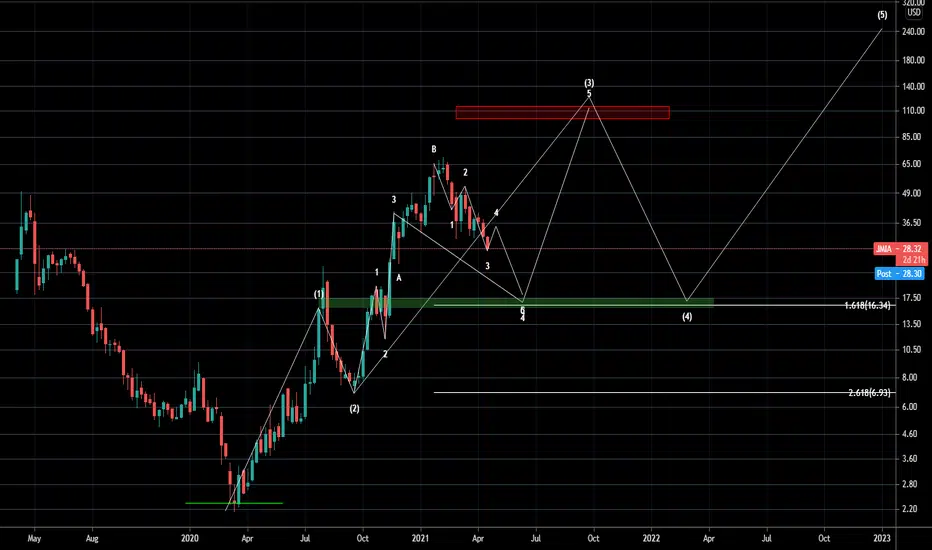
Long | JMIA | Intraday | 5/7/2021NYSE:JMIA
Possible Scenario: LONG
Evidence: Price Action
TP1~ 26.80
3% Profit
Call options, Strike 27$, 05/07/21
JMIA/N trade ideas

$JMIA Update 5/5 Technical Analysis and Breakdown. Video breakdown on $JMIA after a sharp rejection and gap down

$JMIA Technical Analysis and Breakdown $AMZN News??!?Here is a recap and breakdown on $JMIA after a huge pop in volume on running all the way from 29.60 to 32 with a quickness. This was seemingly a response to $AMZN rumors that I havent found much details on but I will update when I do.

JMIA -Good level to buy is now and till 33Good support at 31 on closing basis.
today's doji candle says indecisive price action.
I strongly feel it will make one move towards 40 and if starts closing above 40 will give more fireworks till 47.
Good level to buy is now and till 33.


Jmia updateGot rejected at Head and shoulder neckline. Needs to break back above that and then Push through downtrend resistance. Honestly, these are some major obstacles, we will need alot of volume. Maybe some company specific news or huge price upgrade but as you can with what happened this week the current volume won't cut it. 36.50 would be a safe entry

Watching this earnings playI was in JMIA in the past once before and it rewarded me well.
Earnings in a few weeks.
Will keep my eye on this.
Looking for breakout out of the wedge, but it could go a little lower first.
Would consider an entry closer to $27.
A little higher risk here for the african amazon.
DYOR.


Jmia .. Cup and HandleMonthly chart.. Waiting for the breakout
showing a Hammer reversal for the month of April


JMIA Over SoldWith an RSI of 37 JMIA is ver over sold. The price bounced nicely off the 200 MA and the MACD is starting to curl up. Additionally the current price is well under the YTD POC line which is at $37.21. Price closed above the .38 fib level after testing the .5 level and the 9ema.
This looks very bullish and it appears to be a low risk entry point. I will be watching for JMIA to hold the 200 MA as support and will start accumulating at this level.
Targets: $35.86. $41.23, $50

JmiaOversold on RSI
Bounced off the bottom of channel
You could enter here with minimal down side or wait for a breakout of downtrend(yellow line)


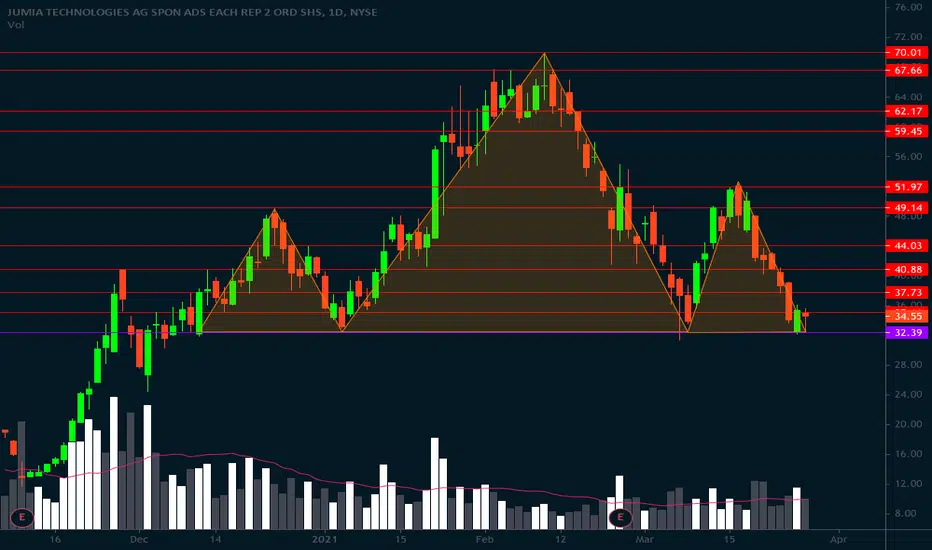
Head and Shoulders TopTall structure. Be safe if long.
The neckline is 33. A breech of the neckline with a downtrend is a short signal for many.
No recommendation.
This is a bull market, so far, and head and shoulders patterns do not always perform well.


Jumia $JMIA - investment idea 💡This stock been trading for a while in the demand zone, giving great opportunity to buy the dip for it's low risk and great target potential. I expect it to up if not today it will be in a few days.
❌ - Volume looks good bust still under the average
✅ - Double bottom
✅ - Bullish price action on the daily (Bullish Doji)
✅ - MACD
✅ - STOCH
✅ - Momentum
✅ - DeMarker
❌ - MA50 (-23.9%)
✅ - MA200 (+31.35%)
❌ - Pivots: (-10.46%)
⏰ - Breakout 1: $40.37
🚀 - Potential targets (🚀247% by 20/07/2021)
🪂 - If things goes wrong better to exit if $32.60 didn't hold
🚦 - Next entries in case if dropped: $26.82
⚠️ - This idea is based on my technical analysis only. Do your research and trade on your own risk!


$JMIA 4/6-7 UPDATE (Technical Analysis) Video breakdown on $JMIA going into 4/7 Up over 4% today with a nice bullflag into the 1hr 9ma. Should see at least $41 tomorrow if the market trends up.


$JMIA technical analysisHello, today I've analyzed NYSE:JMIA . I'm looking for constructive criticism since this is my first published idea. My short term sentiment for this stock is bearish but in the long term this stock will shine!
This stock has been beaten down not because of bad fundamentals or catalysts but It has been dragged down with the rest of the disruptive company stocks. I see this as a great opportunity for getting good deals.
Why It will keep going down
Current market sentiment towards inovative tech and e-commerce is bearish.
Bearish continuation pattern.
Bearish momentum towards the downside not slowing down.
Broke straight through previous support.
Price targets
My short term price target is bearish towards $28.
My mid term price target is bullish but this depends heavily on how fast the market rebounds. There for I will not set a mid term pt.
My long term price target for this stock is $68.
Conclusion
Personally I believe this company has a fundamental idea and It will dominate the African e-commerce market since It has no competitors in this space.
This stock is a buy even at these prices, but I would wait for It to go down to the low $26 high $29 levels before buying more shares.
OBS
Note that I'm a little biased towards this stock since I hold shares in It! My GAV is $37 and I will be averaging down.
