MS trade ideas
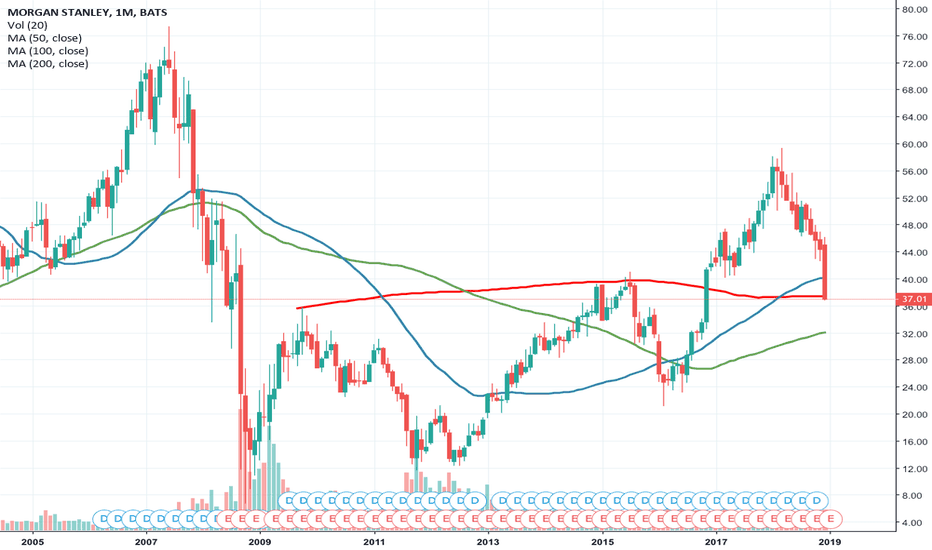
Morgan Stanley | Bearish sentiment ahead of earnings. Looking at Morgan Stanleys chart.
The SQZ indicator continues to turn hard green. Indicating further down side.
The stock has been ascending on descending volume. Bearish sentiment.
The MacD is about to have a bearish crossover.
The chart follows the bearish sentiment that is seen across the market.
Huge Sell off for Morgan StanleyMorgan Stanley shows very little growth potential even at the market dip. While it still a conservative hold for potential long term positions, the amount of risk is outrageous right now. Even after hiring of a new Chief Investment Officer and upgraded management, it looks like a strong sell off is definitely a market recommendation for Morgan Stanley as it is likely to decrease at $35 which will then be a better buy price. As a wealth management institution, one of the biggest for financial management professionals, the steep recent decline lowers the demand curve for their stock.
Should we short MS?Well, it seems like MS has strong uptrend on 3M, 4M TF but the 1Month TF shows the local downtrend, which can change later in October when the new 3Month session starts.
Trade indicators look good. the RSI > 50, the MACD hasn't any sign to sell, so I expect $50+ at the end of September. the Key Data of MS looks good too, so this company can be the good place for your/my money.
No ENTER price because this is a short review.
Morgan Stanley(MS) bullish bat pattern long opportunityMS has dropped about 25% from its peak.
Now there is a bullish bat pattern with extremely small stop loss.
That would be a worth noticing trading/investing opportunity
Of course there's no need to buy MS with such small stop loss so I'll prefer to put the out at least below 45.00 ;
Also, some intraday reversal sign to get quick 1st kick is also a good idea!
Let's see how it goes!


