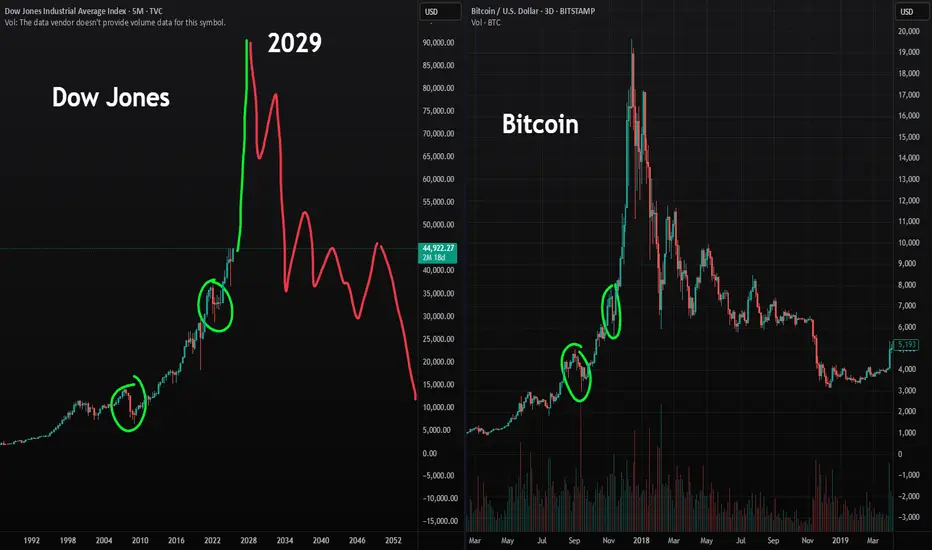
US STOCK MARKET PUMP AND DUMP.My view on the U.S. economy: The U.S. stock market is ready for a blow-off top (similar to Bitcoin in 2017, but a larger fractal of the same psychology). This will lead to a Great Depression 2.0. The smartest thing you can do is buy assets like crypto now, get rich, take profits on everything, and prepare to buy the dip in the housing market, land market, stock market, and everything else during the upcoming crash. I believe this will top out in 2029, marking a 100-year cycle from the last stock market peak in 1929. Crypto will follow it both up and down. This is the official High Altitude Investing position on what’s coming for crypto and the world markets.
As always, stay profitable.
- Dalin Anderson
Dow Jones 30 Future (Continuous futures contract)
45,254.2USDR
+141.0+0.31%
As of today at 10:07 GMT
USD
No trades
DJ30.F trade ideas
US30 Dow Jones Analysis
Dow Jones is getting ready to move, but the big question is:
Will it bounce from 43,670, or wait to touch 42,770?
The answer depends on this week’s trading volume.
🚀 For a real take-off, we need a confirmed close above 44,580;
otherwise, expect a bit of sideways action while the market builds momentum.
This week could be exciting and full of opportunities!

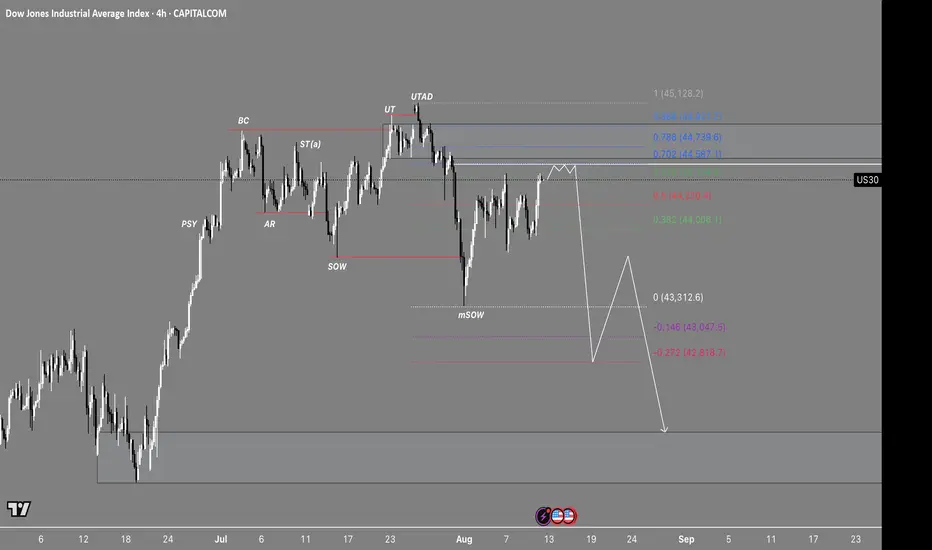
The Giant Prepares to Fall - US30The winds have shifted… patterns only a few will notice are already in motion. What’s coming is written, but not for everyone to read.

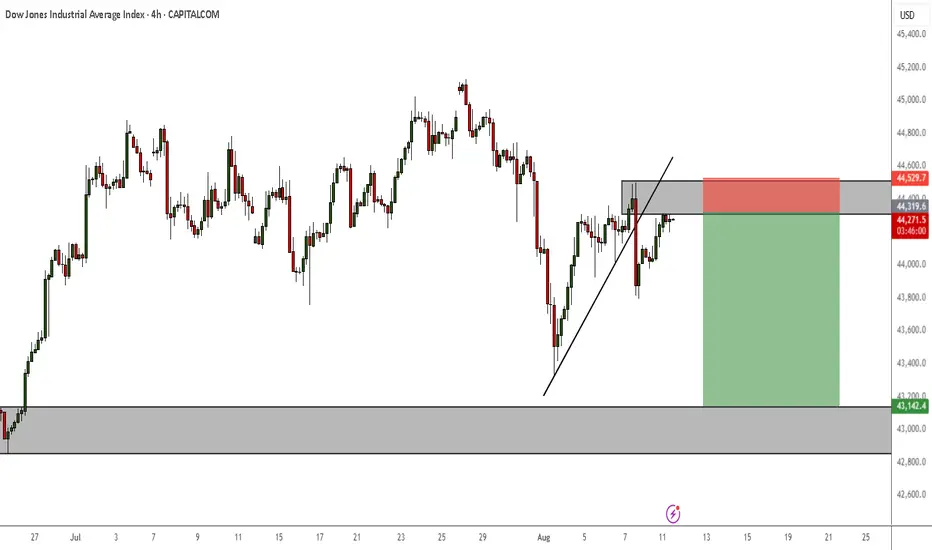
DOW JONES INDEX (US30): Bear Trap & Bullish MovementWe see a clear example of a bear trap on 📈US30 on a 4H time frame
The market initially breached and closed below a crucial support level but then rebounded, and formed an ascending triangle.
A buy signal will be triggered by a bullish breakout above the pattern's neckline, leading us to expect further growth towards 44658.

Dow Jones: Explosive US30 Trade Setup – Entry,Trap & Exit Mapped💎 Dow Jones Robbery Blueprint: The US30 Vault Crack Plan 💎
(Maximized for reach — within TradingView title limit)
🌟Hi! Hola! Ola! Bonjour! Hallo! Marhaba!🌟
Dear Market Robbers & Money Movers 🕵️♂️💰🚨
This ain't your average analysis — it’s a Thief Trader-style 🔥tactical mission🔥 aimed at the mighty "US30/DJI" (Dow Jones Industrial Average). We're talkin' about a precision heist with a full blueprint: entry zones, trap setups, and escape exits. Read carefully — this ain’t for the faint-hearted traders! 🧠🦾
🧠 Entry Zones (The Break-In) 📈
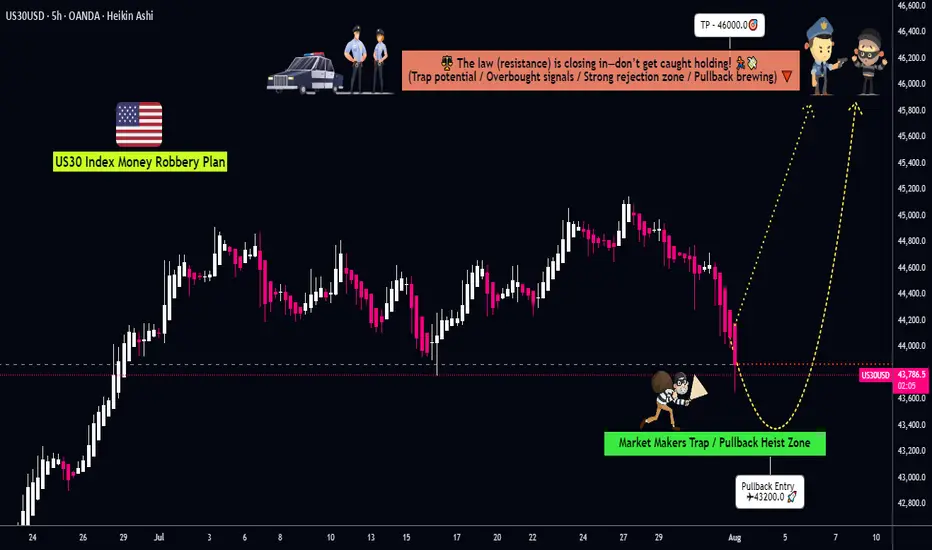
🛠 ENTRY 1: Candle wick near 44200.0 – that’s the resistance gate. Wait for confirmation.
🎯 ENTRY 2: Sneak in at the Market Makers’ Trap around 43200.00 – a dirty zone where retailers get baited. Perfect time to strike long!
🧱 DCA/Layering strategy recommended. Stack those buy orders like a thief layering explosives on a safe. 💣💸
🛑 Risk Levels (Escape Routes/Stop Loss)
🔊 "Listen up, vault raiders! Never drop your SL until breakout is confirmed. If you jump early, you might land in a bear trap! 🪤"
🔐 Stop Zones (Based on Strategy):
🔐 Max Risk SL (5H TF): If you're deep, your last stand is at 43000.0
☝️ SL depends on your position sizing, number of entries, and risk appetite. Trade like a thief, not a gambler.
🎯 Heist Target (Profit Exit)
🏁 Escape Point: 46000.0 — or exit before heat rises! Don’t be greedy. Rob and vanish. 💨💰
🔥 Market Mood: Why the Heist Is On
"US30/DJI" is bullish AF — thanks to:
📊 Macro-Economic Wind at Our Back
📈 Institutional momentum
📰 Strong sentiment and intermarket flows
Check your chart radar: Fundamentals + technicals aligning = green light for robbery! 🟢
⚠️ Tactical Reminder: News Can Jam the Plan
📵 Avoid new entries during major economic releases
🛡 Use trailing SLs to protect running trades
Stay alert, stay alive. 💡
❤️ Support the Robbery Crew
Hit that 💥BOOST💥 — your love fuels our next mission.
Join us and ride daily heist plans with Thief Trading Style 🏴☠️🚀💰
US30 H4 | Bearish reversal off pullback resistanceDow Jones (US30) is rising towards the sell entry at 44,580.75, which is a pullback resistance and could reverse to the downside.
Stop loss is at 45,125.93, which is a swing high resistance.
Take profit is at 43,884.40, which is a swing low support.
High Risk Investment Warning
Trading Forex/CFDs on margin carries a high level of risk and may not be suitable for all investors. Leverage can work against you.
Stratos Markets Limited (tradu.com ):
CFDs are complex instruments and come with a high risk of losing money rapidly due to leverage. 65% of retail investor accounts lose money when trading CFDs with this provider. You should consider whether you understand how CFDs work and whether you can afford to take the high risk of losing your money.
Stratos Europe Ltd (tradu.com ):
CFDs are complex instruments and come with a high risk of losing money rapidly due to leverage. 66% of retail investor accounts lose money when trading CFDs with this provider. You should consider whether you understand how CFDs work and whether you can afford to take the high risk of losing your money.
Stratos Global LLC (tradu.com ):
Losses can exceed deposits.
Please be advised that the information presented on TradingView is provided to Tradu (‘Company’, ‘we’) by a third-party provider (‘TFA Global Pte Ltd’). Please be reminded that you are solely responsible for the trading decisions on your account. There is a very high degree of risk involved in trading. Any information and/or content is intended entirely for research, educational and informational purposes only and does not constitute investment or consultation advice or investment strategy. The information is not tailored to the investment needs of any specific person and therefore does not involve a consideration of any of the investment objectives, financial situation or needs of any viewer that may receive it. Kindly also note that past performance is not a reliable indicator of future results. Actual results may differ materially from those anticipated in forward-looking or past performance statements. We assume no liability as to the accuracy or completeness of any of the information and/or content provided herein and the Company cannot be held responsible for any omission, mistake nor for any loss or damage including without limitation to any loss of profit which may arise from reliance on any information supplied by TFA Global Pte Ltd.
The speaker(s) is neither an employee, agent nor representative of Tradu and is therefore acting independently. The opinions given are their own, constitute general market commentary, and do not constitute the opinion or advice of Tradu or any form of personal or investment advice. Tradu neither endorses nor guarantees offerings of third-party speakers, nor is Tradu responsible for the content, veracity or opinions of third-party speakers, presenters or participants.

Dow moneyThere is weekly daily and intra week levels. The definition of balance but once must pour its way above the 50%. 1H 4H areas will look to stay above our average sellers. Which draws price to one side or another. In the other direction we can be looking at staying below our average buyer. Need to track the money, set it up on the trap, then play the side that is heavier on the scale for weight.

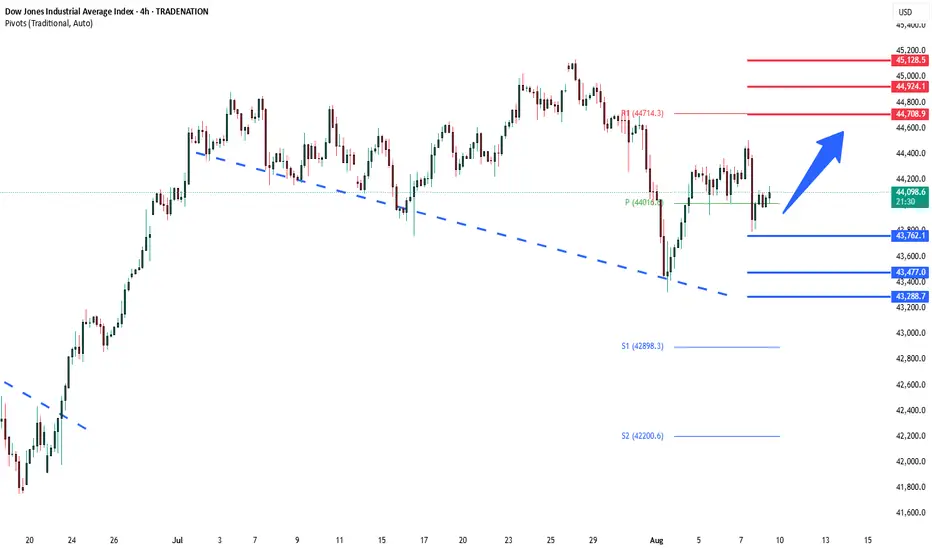
DowJones key trading levelsKey Support and Resistance Levels
Resistance Level 1: 44700
Resistance Level 2: 44924
Resistance Level 3: 45130
Support Level 1: 43760
Support Level 2: 43477
Support Level 3: 43288
This communication is for informational purposes only and should not be viewed as any form of recommendation as to a particular course of action or as investment advice. It is not intended as an offer or solicitation for the purchase or sale of any financial instrument or as an official confirmation of any transaction. Opinions, estimates and assumptions expressed herein are made as of the date of this communication and are subject to change without notice. This communication has been prepared based upon information, including market prices, data and other information, believed to be reliable; however, Trade Nation does not warrant its completeness or accuracy. All market prices and market data contained in or attached to this communication are indicative and subject to change without notice.
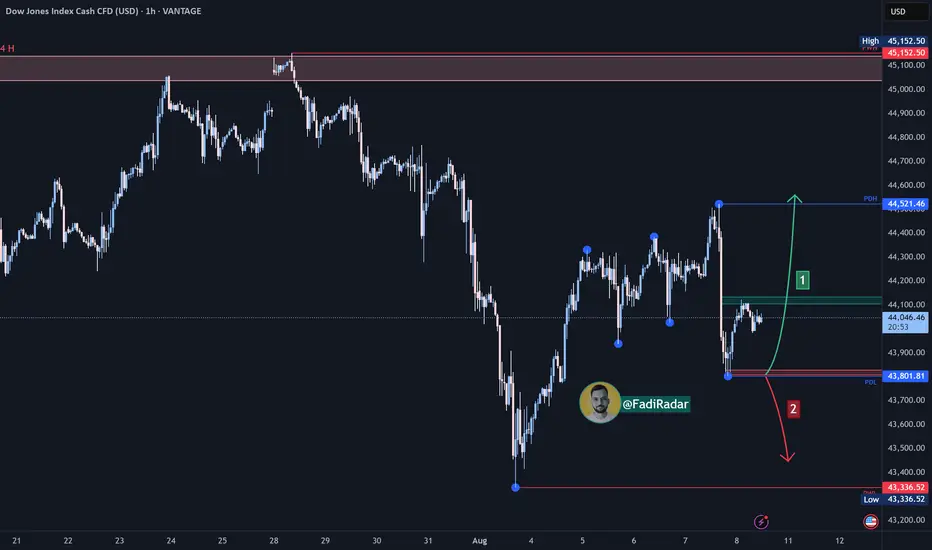
Dow Jones Index (US30 / Dow Jones) Analysis:The Dow Jones index is currently moving sideways and is trading near the $44,000 level.
🔻 Bearish Scenario:
If selling pressure leads to a break below the $43,800 area, the index may drop to test the $43,300 level, which is considered a critical support in the short term.
🔺 Bullish Scenario:
The price may test PDL (Previous Day Low) at $43,800 as a support zone and bounce upward. If the index breaks and holds above $44,100, this could lead to a continuation toward $44,520, and then to $45,000, a key resistance zone.
⚠️ Disclaimer:
This analysis is not financial advice. It is recommended to monitor the markets and carefully analyze the data before making any investment decisions.
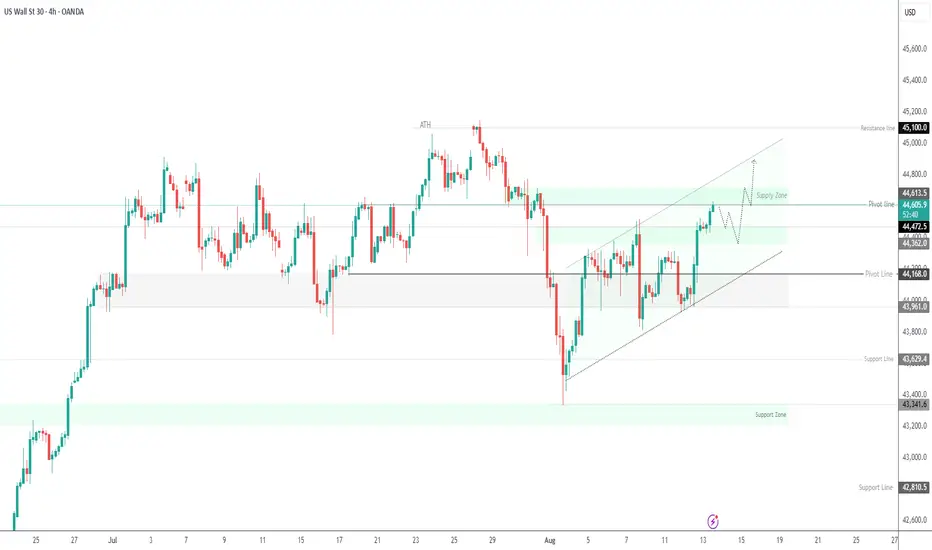
Dow Jones IndexThe index is currently trading near the 44,310 resistance level, which is a key zone. Possible scenarios:
1️⃣ Bullish Scenario:
If the price breaks and holds above 44,310, it could target 44,520 and then 44,800 as strong resistance levels.
2️⃣ Bearish Scenario:
If the index fails to break the current resistance and falls below the support at 43,980, a corrective move towards 43,520 might follow.

Dow Jones Slides on Tariff News – What’s Next?US30 – Market Overview
US30 dropped nearly 600 points yesterday ahead of the announcement of new tariffs, adding pressure to the broader market.
Technical Outlook
Bearish Scenario:
While price remains below 44170, bearish momentum is favored, targeting 43960.
A confirmed break below 43960 would likely extend the decline toward 43630.
Bullish Scenario:
A 1H close above 44170 would shift the bias to bullish, targeting 44360 and possibly 44470.
Support: 43960 – 43630
Resistance: 44360 – 44470

US30 | Post-CPI Surge – Key Levels at 44470 & 44610US30 Overview
The Dow Jones surged over 500 points on Wednesday, supported by growing confidence that the Federal Reserve could restart its monetary policy easing cycle next month.
A softer CPI report, following weak non-farm payrolls, has strengthened the case for a September Fed rate cut.
Technical Outlook:
The price appears to be in a corrective move toward 44470 before resuming its bullish trend.
Below 44470, the bias turns bearish toward 44170.
A 1H close above 44610 would support a bullish move toward 44730 and 44950.
Support: 44470, 44360, 44170
Resistance: 44710, 44920, 45100
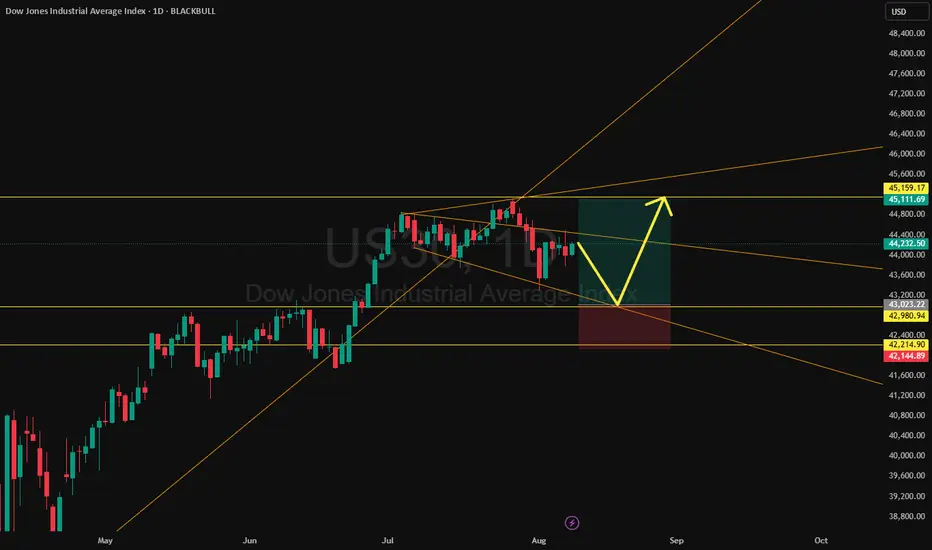
DOW JONES Channel Up on its strongest Support.Dow Jones (DJI) has been trading within a Channel Up since the April 25 Low and right now it is consolidating straight after a direct contact and bounce on the 1D MA50 (blue trend-line).
Given that this also took place at the bottom of the Channel Up, it is a technical Higher Low formation, thus the strongest Support level possible.
With the 1D RSI also rebounding around the same level as the previous Higher Low, we expect the next technical Bullish Leg of the Channel Up to begin. The previous two rose by at least +7.00%, so the minimum Target we are looking for on the short-term is 46350.
-------------------------------------------------------------------------------
** Please LIKE 👍, FOLLOW ✅, SHARE 🙌 and COMMENT ✍ if you enjoy this idea! Also share your ideas and charts in the comments section below! This is best way to keep it relevant, support us, keep the content here free and allow the idea to reach as many people as possible. **
-------------------------------------------------------------------------------
Disclosure: I am part of Trade Nation's Influencer program and receive a monthly fee for using their TradingView charts in my analysis.
💸💸💸💸💸💸
👇 👇 👇 👇 👇 👇

DOW JONES Holding the 1W MA50 can push it to 50900.Dow Jones (DJI) has been trading within a massive 3-year Channel Up (almost) and following the April 07 2025 rebound on its 1W MA200 (orange trend-line), it's been unfolding the new Bullish Leg.
Having established also the 1W MA50 (blue trend-line) as its Support in recent weeks, the pattern should now aim for its new Higher High long-term. Every time the index broke and stayed above its 1W MA50 during both previous Bullish Legs, a strong sustainable rally took place.
Given the similarities between their 1W MACD sequences as well as the fact that +39.51% has been a common long-term rise, we expect Dow to top next around 50900.
-------------------------------------------------------------------------------
** Please LIKE 👍, FOLLOW ✅, SHARE 🙌 and COMMENT ✍ if you enjoy this idea! Also share your ideas and charts in the comments section below! This is best way to keep it relevant, support us, keep the content here free and allow the idea to reach as many people as possible. **
-------------------------------------------------------------------------------
Disclosure: I am part of Trade Nation's Influencer program and receive a monthly fee for using their TradingView charts in my analysis.
💸💸💸💸💸💸
👇 👇 👇 👇 👇 👇

US30: Local Bearish Bias! Short!
My dear friends,
Today we will analyse US30 together☺️
The recent price action suggests a shift in mid-term momentum. A break below the current local range around 44,812.15 will confirm the new direction downwards with the target being the next key level of 44,535.28 and a reconvened placement of a stop-loss beyond the range.
❤️Sending you lots of Love and Hugs❤️


KOG - US30Moving on from the previous chart we shared on DOW you can see our red box worked well and gave us the move we wanted upside, however, we stopped just short of the ideal target level.
For that reason, and after looking at the liquidity indicator we will monitor the boxes here for a possible retracement.
As always, trade safe.
KOG

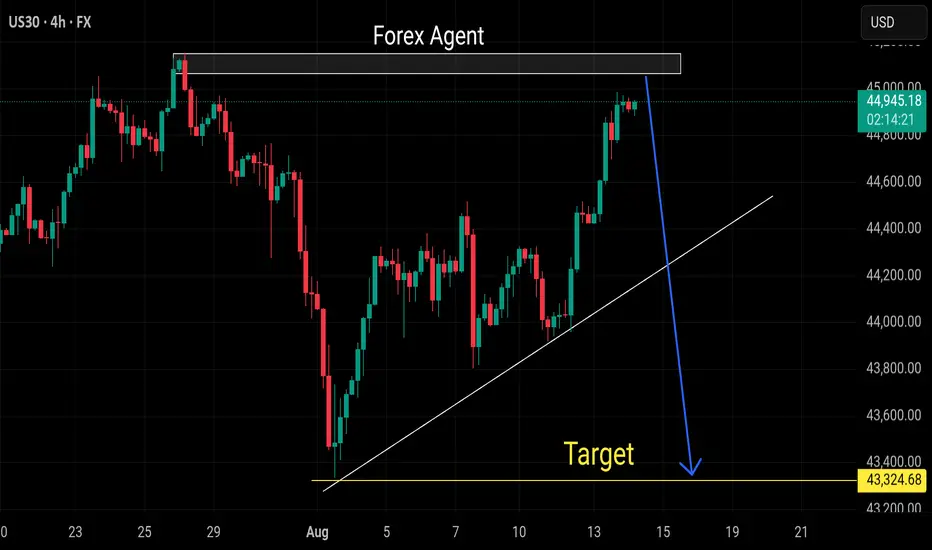
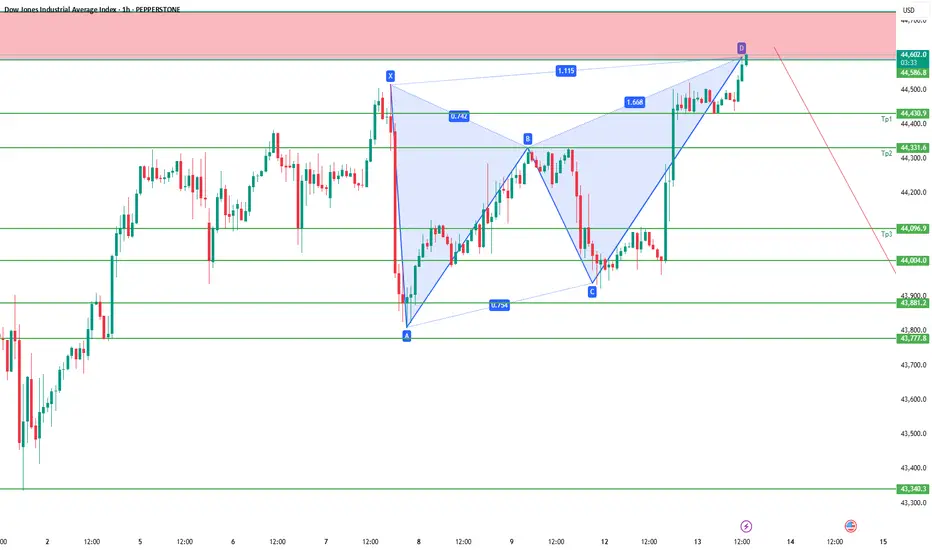
Will the Dow Jones revisit the 43,340 level ?!Will the Dow Jones revisit the 43,340 level, or are we heading for a new high?
A Gartley pattern has formed on the Dow Jones, aligning with a supply zone between 44,585.00 – 44,725.00.
If the Dow stays below this zone, we will monitor price action on the 4-hour and daily charts for confirmation of a potential decline.
Expected downward targets based on price action:
1. 44,430.00
2. 44,330.00
3. 44,095.00
4. 44,000.00
5. 43,880.00
6. 43,775.00
7. 43,340.00
On the other hand, if the 44,725.00 level is broken and closed above, the Dow Jones is expected to move toward the historical high at 45,160.00.
A close above this level would signal a new high for the Dow.
Can You Escape the US30 High Voltage Trap in Time?💎 US30/DJ30 High Voltage Bullish Heist Plan 💎
💰 Asset: US30 / DJ30 Index CFD
🚀 Plan: Bullish — Thief OG Layered Buy Attack 🏴☠️
📍 Entry: Any price level — we’re layering in with the Bull Grid Strategy like a true market bandit.
🎯 Layered Buy Limits:
44,900 💵
44,700 💵
44,400 🔥
(💡 You can add more layers — the more vault doors you crack, the more loot you grab!)
🛑 Stop Loss: Thief SL @ 44,000 🛑 — adjust to your own risk appetite & strategy, ladies & gentlemen of the Thief OG Crew.
💎 Target: 46,300 🎯 — ⚡ high-voltage electric trap ahead! Escape with the stolen money at 46,200 before the market guards catch you.
🏴☠️ The Heist Blueprint 🏴☠️
We’re hitting US30 with multi-layer entries, scooping up the dip zones like professional vault breakers. The bull gang is in control — momentum, sentiment, and greed all lining up for a payday.
Rules of Engagement:
Use multiple buy limit layers — stack ‘em like gold bars.
Stick to longs only — don’t rob against the tide.
Place alerts at each limit level — no sleeping during the heist.
Use trailing SL to secure stolen profits while the robbery’s still in progress.
📊 Why Bullish?
US30 showing strong momentum fueled by market optimism, earnings strength, and liquidity flooding in. Macro vibes = bullish; sentiment = greedy. Bears? Scattered and broke.
⚠️ Risk & News Alert:
Avoid entry during high-volatility news drops — even thieves hate unpredictable explosions.
Manage positions like a pro — protect the stash.
💖 If this heist plan makes you richer or braver, hit that BOOST and join the Thief Trader Army. Every boost powers our next robbery.
🏆 We steal from the market, not from people.
See you at the vault door, Thief OGs. 🏴☠️💰🚀

