Bullish IntradayPrice made a higher high at 99.836, breaking the previous lower high. This suggests a potential shift in structure to bullish. Buy Stops Above Highs: The high at 99.836 likely took out buy stops from traders expecting a breakout above 100.000. ICT emphasizes that smart money often hunts liquidity above equal highs or below equal lows. Bearish Order Block: The green box around 99.750–99.800 (before the drop to 99.500) acts as a bearish order block. This is a zone where institutional selling occurred, leading to the sharp decline. Price briefly retested this zone before rejecting it, confirming its significance. Last scenario would be, Pullback and Reversal: A likely ICT setup would be a pullback to the 99.650 pivot or the 99.500 bullish order block, followed by a move higher to target liquidity above 100.000.
DX.F trade ideas


US exceptionalism is overwhat if te era of us exceptionalism is over.
The dollar will still be reserve curency but demand will be serverly cut, faith in the us fails and the dollar reprices back to where it was.
right now not looking great. im not call for death of the dollar just a repice back to normality
Dxy looks ike it could jsut sweep all the way back

Despite long-term support, the dollar is eyeing deeper watersAlthough the US Dollar (USD) Index has connected with a monthly support area between 98.72 and 99.67, April’s lower low at 99.01 reached levels not seen since early 2022 and price crossing below the 50-month simple moving average (SMA) at 101.91 potentially questions this support zone.
Bolstering the likelihood of additional downside in the USD are the daily and H4 charts. The former exhibits scope to reach support at 98.58 (and formed a Death Cross ), while the latter completed a bearish pennant pattern (ruptured the lower boundary), extended from 100.64 and 99.01. As you can see, H4 action is currently retesting the underside of the breached pattern’s border.
In view of the above technical surroundings, USD shorts could have some gas left in the tank.

top is in for the dxygm,
this idea has been in the works for years, ever since we topped out 3 years ago. there has been quite a bit of variations of this idea, but this one right here has been my primary idea for a very long time.
initially i imagined the dxy coming up to 111-113 before topping out, and i reckon it still can, but the worst is behind us, relatively speaking.
---
if my count here is correct, the dxy will begin extending down into wave c into the last days of 2025 where a major low will be put in place .
this will create a hyper-parabolic bull phase for risk assets, in conjunction with declining rates.
---
if you've been waiting for a signal to buy alts
this is your signal.
🌙
---
ps. view my private idea from last year via:
🌙

How far could the USD fall?.. WATCH THE DOLLAR INDEXThe dollar is declining as US uncertainty continues and cash moves out of the US. I personally think the dollar will bounce, but how far could it fall in the meantime...
Price is testing the previous monthly horizontal resistance as support and the monthly 100 SMA. The dollar may find a bottom here. From 98 to 100 on TVC:DXY
Price may reach the monthly bullish channel support. There will likely be technical buyers in this area. From 95 to 96 on TICKMILL:DXY
Good luck!

DeGRAM | DXY dropped below 100 pointsDXY is in a descending channel between trend lines.
On the downside, the price has formed a gap and dropped below 100 pips and has already reached the lower trend line.
The chart maintains a descending structure but has already formed a harmonic pattern and a descending wedge.
On the major timeframes, the index relative strength is in the oversold zone and on the 30m Timeframe it is forming a bullish convergence.
We expect a reversal after a support retest.
-------------------
Share your opinion in the comments and support the idea with like. Thanks for your support!

DXY aka usd 15 Apr 2025Price is ranging within a triangle, a break below will confirm the wave count.
Following the move down from a triangle, it suggest the move down is completed and a reversal at least for the short term will proceed next.
Waiting for the break and move lower and a rejection bounce to suggest a bottom is in.
Will long usdjpy, short eurusd gbpusd etc when the above comes true
Good luck.


DXY Current Outlook 4hr , Daily and weekly analysisAt its current level, the DXY (US Dollar Index) is at a critical zone where a potential bullish reversal could occur. It is plausible that the index could reverse somewhere between the 99.50 – 98.00 range. However, there is also a possibility that this zone could break, leading to further downside continuation, potentially targeting the 96.23 – 93.95 levels.
It’s important to always watch for potential reversal signs at key levels. The reversal, if it happens, will likely be confirmed by certain indicators or patterns—like reversal candlestick formations—that we’ve mentioned before. Once price reaches those zones, look out for any of those confirmation signals, and use your own trading experience to validate them.
That being said, it’s also realistic to consider that the current zone (between 99.00 – 98.00) might already be the point where the dollar begins a strong recovery.
Note: All scenarios are valid, and key levels should be monitored closely for signs of a shift in momentum TVC:DXY

DXY/USD sell 1D chart analysisThis chart is for the US Dollar Index (DXY) on the daily timeframe (1D) from FXOPEN. It shows a clear bearish trend structure with multiple CHoCH (Change of Character) and Break of Structure (BoS) labels, indicating a bearish market sentiment.
Chart Analysis Summary:
The DXY is in a downtrend, showing successive lower highs and lower lows.
There's a strong supply zone marked in red around the 107.8–110.8 level.
Price has just broken below a previous structure, suggesting continuation downward.
Trade Setup (SELL):
Entry Point: Around 99.800 (current price zone or slightly after a minor pullback)
Stop Loss (SL): 101.00 (above the most recent high/supply zone and invalidation area)
Take Profit 1 (TP1): 96.000 (first key support zone)
Final Target (TP2): 89.400 (major support zone as seen on the chart)
Text You Can Share with Your Client:
---
DXY SELL SETUP – Daily Timeframe
The US Dollar Index (DXY) has shown multiple bearish CHoCH and BOS confirmations. Price has broken key structure and is currently retesting a premium area. We are anticipating continued bearish pressure based on trend structure and liquidity targets below.
Entry: 99.800
Stop Loss: 101.000
Take Profit 1: 96.000
Final Target: 89.400
This setup aligns with overall market structure and momentum. Stay updated for management and scaling instructions.

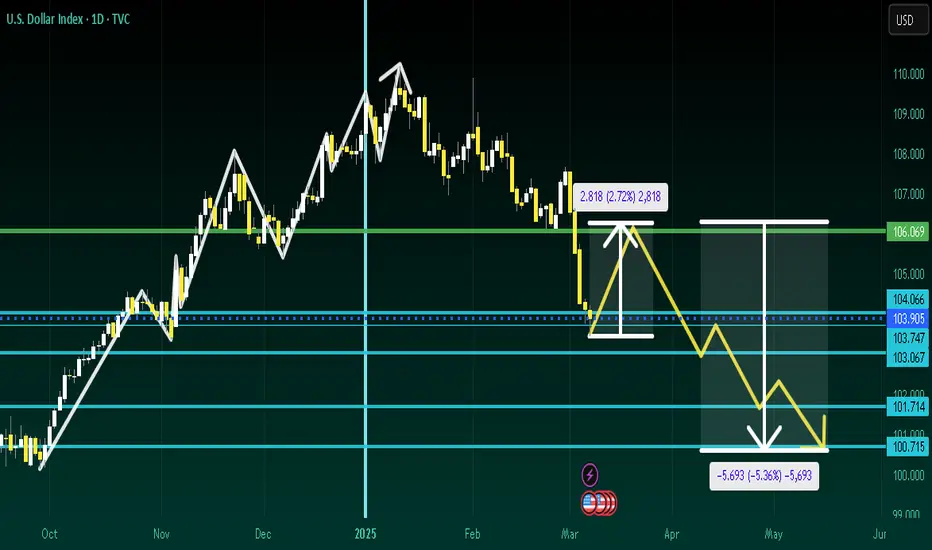
U.S. Dollar Index (DXY) – Key Resistance & Bearish Target Analys📊 Key Observations:
🔵 Resistance Zone (📍~103.5 Level)
A strong resistance area (🔵 blue box) is marked, indicating potential selling pressure if the price reaches this level.
The price is moving upwards (📈) towards this resistance, so watch for rejection or breakout.
🔵 Support/Target Zone (📍~101.5 Level)
A lower support zone (🔵 blue box) is marked as the bearish target 🎯.
If the price fails at resistance, it may head downwards (📉) to this level.
📉 Recent Price Action:
🚀 Sharp drop followed by a rebound (📈).
The price is currently moving back up (🔼), possibly forming a lower high before another drop.
📌 Exponential Moving Average (DEMA 9 - 102.488)
The price is hovering above the 9-period DEMA (📏), showing short-term bullish momentum.
If the price rejects resistance and falls below the DEMA, a bearish continuation (📉) is likely.
🚀 Potential Scenarios:
✅ Bullish Breakout: If price breaks above 🔵 resistance, it may continue rising (📈) to higher levels.
❌ Bearish Rejection: If price fails at resistance, expect a drop (📉) towards 101.5 🎯.

The Great Long. DXY LIQUIDITY GAME.We knowgood old SEC days are coming, Fed Pivot is coming and a strong dollar is coming with it. But for now
Let me explain you this chart.
The chart is on a weekly timeframe but all the points of interest and liquidity can be perfectly seen on the monthly as well.
I want to show you how price moves from liquidity zone to liquidity zone touching specific areas no matter what.
Following all the red lines that are previous highs that the price made (liquidity) and the low from July 2023.
For me this chart is pure art, this is the game I look for when daytrading, but for this being on a weekly/monthly chart is just mesmerizing.
This previous -10% drop from Jan-Feb till today, comes from a very specific point in the chart.
And the +15% pump that I see, is coming from a very specific point as well.
As you can see this drop comes after liquidating several highs (sellside liquidity) on the way to a predominant imbalance that respected perfectly. What I want to say is that price follow liquidity first then touches a specific zone and respects it.
Now, we have the same scenario but now we have targeted July 2023 low and a weekly imbalance. A significant low has been triggered and a point of interest has been fille. Fed Pivot is coming and we expect to see a strong dollar in the long run.
I think this is just the perfect point in the chart for direction to shift and to start to price-in what is about to come. Last monday (Black Monday) was a climatic point.
Events bring the volatility for price to make it where it has to,
I think this is the turning point.
I hope you enjoyed the content this is NOT Financial advice. I just want this analysis and info to be here.

Dixie 41625Still in a long term uptrend and testing the lower range of its rising channel. Uncertainty may bring short term vol to the downside . But once the world understands that this is a global crisis. Dollar will once again gain strength against all others, Euro, Japanese Yen, British Pound, Canadian Dollar, Swedish Krona, Swiss Franc. The dollar will rip to new highs and continue its golden retrace target.
Bitcoin down, which ive said. Gold and silver continue marching up. Real things hold stable and are the only true stores of value.

Big Drop Ahead on DXY! Smart Money Already Selling!”Idea in Simple Terms:
Bias: Bearish.
Current Position: Wave B or early C.
Action Plan: Look for sell setups in the minor resistance zones.
Final Target: 92.00–94.00 area .
“Key Idea” Illustration:
This shows a simplified roadmap:
DXY is expected to rally slightly into the minor resistance.
Then, a sharp drop toward the blue demand zone, respecting the ABC correction.


The impact of tariffs on the DXYIn the long term, the imposition of tariffs will trigger countermeasures from trading partners 😡, leading to a shrinkage of the global trade scale 😔. The import costs of raw materials for American enterprises will rise, and their export markets will be restricted, which will curb the economic growth of the United States 😩. This will exert depreciation pressure on the US dollar, causing the DXY to decline 📉.
U.S. Tariff Policies
Since April 9th, the United States has imposed tariffs ranging from 10% to 25% on goods from China, the European Union, Canada, and other regions, covering key sectors such as automobiles, steel, and semiconductors.😒
Countermeasures of Various Countries
China: On April 4th, China announced that it would impose a 34% tariff on U.S. goods starting from April 10th. On April 9th, the tariff rate was further increased to 84%, covering all U.S. goods.😠
The European Union: Announced that it would impose a 25% tariff on U.S. motorcycles, diamonds, and other goods starting from May 16th.😤
Canada: Imposed a 25% retaliatory tariff on U.S. automobiles on April 9th, but exempted auto parts.😏
This upward movement has led to the clearing of many traders' accounts or significant losses 😫. You can follow my signals and gradually recover your losses and achieve profitability 🌟.
💰💰💰 DXY 💰💰💰
🎯 Sell@103 - 100
🎯 TP 96 - 94
Traders, if you're fond of this perspective or have your own insights regarding it, feel free to share in the comments. I'm really looking forward to reading your thoughts! 🤗


The DXY shows a downward tendency.In the long run, the implementation of tariffs will prompt trading partners to take countermeasures 😡, resulting in a contraction of the global trade scale 😔. American enterprises will face higher import costs for raw materials, and their export markets will be restricted, thus curbing the economic growth of the United States 😩. This will put depreciation pressure on the US dollar, causing the DXY to decline 📉.
U.S. Tariff Policies
Since April 9th, the United States has levied tariffs ranging from 10% to 25% on goods from China, the European Union, Canada, and other regions. These tariffs cover crucial sectors like automobiles, steel, and semiconductors 😒.
Countermeasures of Various Countries
China: On April 4th, China declared that it would impose a 34% tariff on U.S. goods starting from April 10th. Then, on April 9th, the tariff rate was further hiked to 84%, applying to all U.S. goods 😠.
The European Union: Announced that it would impose a 25% tariff on U.S. motorcycles, diamonds, and other goods as of May 16th 😤.
Canada: On April 9th, imposed a 25% retaliatory tariff on U.S. automobiles, while exempting auto parts 😏.
💰💰💰 DXY 💰💰💰
🎯 Sell@ 100 - 101
🎯 TP 98 - 97
Traders, if you're fond of this perspective or have your own insights regarding it, feel free to share in the comments. I'm really looking forward to reading your thoughts! 🤗
👇The accuracy rate of our daily signals has remained above 98% within a month! 📈 We sincerely welcome you to join our channel and share in the success with us! 👉

DXY NEXT MOVE AND MARKET EFFECTThe US Dollar Index (DXY) is currently testing a major multi-year support zone around the 99.70–100.00 level. This level has held firm multiple times in the past, acting as a strong demand area during key macroeconomic cycles. Right now, price action is showing indecision with a clear do-or-die moment forming. If bulls defend this zone, we could witness a significant bullish reversal, potentially targeting the 103.00–105.00 range. However, a decisive break below this support could trigger a bearish wave toward the 96.00 handle or even lower.
Technically, this zone is not just psychological, but also a structural demand region, aligning with previous swing lows and price pivots. We’re seeing a potential for either a double bottom reversal or a breakdown structure forming, depending on how the market reacts in the coming sessions. Price is extremely oversold on higher timeframes, which could fuel a relief rally if momentum shifts. The reaction here will be key for broader market direction, especially as the dollar plays a pivotal role across forex majors.
Fundamentally, the DXY is under pressure as recent U.S. macro data reveals weakening momentum. March CPI printed hotter than expected, but other indicators like core PCE, NFP softness, and signs of slowing consumer demand are fueling expectations that the Fed may be nearing a policy pivot. At the same time, global risk sentiment is improving and yields have pulled back slightly, putting pressure on the greenback. However, rising geopolitical tensions and elevated oil prices continue to support USD as a safe-haven asset.
As a professional trader, this is a critical level to watch. I’m keeping an eye on price action confirmation for either a bullish engulfing setup or a clean break and retest of the 99.50 level. Both scenarios offer high-probability trades. Patience here is crucial — let the market reveal its hand, then align with the momentum. Dollar volatility is likely to remain elevated heading into next week, so managing risk with clarity is key.

How to Trade the Tariff Turmoil: Markets Now Move on HeadlinesMarkets in 2025 have become increasingly unpredictable, largely driven by one factor: tariffs. President Donald Trump’s aggressive trade policy has shaken investor confidence and turned global markets into a rollercoaster. The key to navigating this new environment? Understand that markets are no longer just reacting to economic data—they’re reacting to headlines.
The biggest shock came on April 2, when Trump announced a 145% tariff on all Chinese imports and “reciprocal” tariffs on dozens of other countries. The reaction was immediate: the S&P 500 dropped nearly 15% at its lowest point that week, and investors rushed to sell risk assets. Days later, markets sharply reversed after Trump temporarily suspended some tariffs. That sparked a rally—tech stocks soared, Apple rose 5%, and the Nasdaq gained over 2%.
But the relief was short-lived. Conflicting messages and partial rollbacks continued to send markets up and down. Earlier, on March 4, tariffs were placed on Canada and Mexico, while China’s rates were doubled. These moves led to more selling in stocks and a spike in demand for bonds. By mid-April, exemptions for electronics boosted tech names again, but overall market sentiment remained fragile.
How to Trade This New Market
The main lesson for traders and investors is clear:
We’re now in a headline-driven market. Traditional strategies that rely solely on fundamentals or economic cycles are being overshadowed by sudden political developments. Here’s how to adapt:
Stay Nimble and News-Aware
Be ready for fast moves. Market direction can flip in minutes based on a single press conference or tweet. Have alerts set for major geopolitical and tariff-related headlines. Reduce position sizes during uncertainty and avoid holding large trades through major announcements.
Rethink Your Safe Havens
The U.S. dollar is no longer acting like the safe haven it used to be. With rising fiscal concerns and volatile trade policy, investors are shifting toward alternatives. Gold and the Swiss franc (CHF) have become more reliable options during risk-off moments. If uncertainty spikes, these assets may offer better protection than the dollar.
Focus on Sectors Sensitive to Policy
Tech stocks have been among the most affected. Tariff exemptions caused sharp rallies, while new restrictions triggered big drops. If you trade sectors like tech, consumer goods, or industrials, stay especially alert for trade-related headlines.
Bottom line: In 2025, geopolitics is moving markets more than ever. The old playbook needs updating. By staying flexible, tracking headlines, and turning to traditional safe havens like gold and CHF, traders can better navigate the noise—and find opportunity in the chaos.

DXY FORECAST Q1 FY25 : zim dollar dollarBack again with a TVC:DXY doomsday post my judgement at the moment is based of the following reasonings.
📉 Tariffs & Global Trade Impact
Tariffs weaken trade activity: If the U.S. imposes tariffs, it might reduce export competitiveness and disrupt global supply chains. That can lead to lower foreign demand for U.S. dollars, putting downward pressure on the DXY.
Market uncertainty: Investors often move away from riskier assets during trade wars, but if confidence in the U.S. economy declines, they might shift into other safe havens (like gold or the Swiss franc) instead of dollars.
💰 Money Supply Contraction
Dollar scarcity effect: The contraction in M2 money supply could strengthen the dollar temporarily due to reduced liquidity. However, if the Fed eases monetary policy to counter recession fears, it might reverse the effect, weakening the dollar.
📊 Inflation & Real Interest Rates
Sticky inflation: If inflation remains above target (around 2.9%), and tariffs drive consumer prices higher, the Fed may face pressure to hold or hike interest rates — which could eventually support the dollar.
Recession signals: On the flip side, if the economy contracts, rate cuts could come into play, flooding markets with liquidity and pushing the dollar down.
in my opinion
the shrinking money supply points to future deflationary pressures, which historically support the dollar however disruptive trade policies could destabilize growth, undercutting the dollar’s strength.
If tariffs intensify and growth stalls, the dollar may stay weak or decline further despite the contracting money supply. But if the Fed stays firm on inflation control and global instability rises, the dollar could rebound as a safe haven... though this would depend on whether markets believe the U.S. can avoid a full-blown recession.
Like Comment Follow Tip Gift its appreciated for more serious work like this.