US100 Cautious ApproachThe US 100 is looking for direction to move. On the 1H TF previously it have broken downward trend and formed a HH and HL indicating bullishness. but after the first leg it have gone into consolidation.
Cautios appoach is required with patience as per on going geol political condition and uncertanity looming over.
NAS100 trade ideas

NADSDAQ BULLISH SETUP FOR THE WEEKTrade Idea: NASDAQ100 Long Bias (Weekly Setup)
Market Narrative:
The NASDAQ remains bullish across the quarterly, monthly, and weekly timeframes, supported by a strong market structure and ongoing macro sentiment. On Monday, we observed significant bullish displacement, confirming institutional interest and directional intent.
Tuesday Outlook:
A retracement is expected on Tuesday, potentially forming the weekly low. Ideal entries will form around liquidity runs on Asia session lows, offering a high-probability long setup if price reacts bullishly from that zone.
Entry Zone:
Optimal Buy Zone: From 21,700 and below, ideally after a liquidity sweep below Asia session lows or into a previous demand block.
Watch for bullish order flow or market structure shift confirmation around this zone before entering.
Stop Loss:
21,525 (below the liquidity run and protected low)
Take Profit:
Open Target: The market is poised to break all-time highs, so targets should trail based on structure. Consider:
TP1: 22,150 (Previous swing high)
TP2: 22,400+ (Discovery zone / ATH breakout)
Use trailing stop or structure-based exits beyond TP1.
Confluences:
Bullish displacement on higher timeframes
Weekly low likely to form Tuesday
Asia session liquidity below current price
Strong institutional flow into tech
Risk Management:
Risk only 1% of account equity per trade
Position sizing based on entry and SL distance

Nasdaq - The final bullrun breakout!Nasdaq - TVC:NDQ - might break above all structure:
(click chart above to see the in depth analysis👆🏻)
It is quite incredible how volatile stocks have been lately, especially considering that fact that the Nasdaq is about to create new all time highs again. Consequently, we are about to witness a significant structure breakout, which would ultimately lead to another rally of about +30%.
Levels to watch: $21.000
Keep your long term vision!
Philip (BasicTrading)

Nasdaq-100 (NDX) daily analysis Distribution & Accumulation Zone🧭 CAPITALCOM:US100
Market Interpretation & Scenarios
🟢 Accumulation Zone (Demand / Buy-Side Liquidity)
21,640–21,720 region
• Strong buying reaction post-CHoCH + bullish BOS.
• Green FVG + “Long” entry = Smart Money likely accumulating.
• Price made a new HH and is now retracing into the gray FVG & BB zone.
• 🔍 If 21,800–21,775 holds, price may push higher and retest or break 21,960.
• 🎯 Upside Targets: 22,000–22,050 (next liquidity grab).
🔴 Distribution Zone (Supply / Sell-Side Liquidity)
21,920–21,960 region
• Premium zone where HH formed, followed by retracement.
• Red FVG + rejection = Smart Money potentially distributing.
• Failure to close above suggests a temporary distribution range.
• ❗️ If gray FVG breaks down, expect a drop toward green FVG (~21,680) or lower.
• A CHoCH near 21,775 would confirm a bearish shift in structure

USTECH Long Opportunity USTECH is currently on a break out to the upside, resuming the bullish trend. Price broke out above $21820 and is currently on a retracement where it could potentially provide a break and retest level at $21820.
Price is trading above the 50 SMA and is currently showing bullish momentum coming out of the RSI.
There is bullish structure amidst the consolidation present thus its important to trade cautious. Looking to the ride the bullish wave from the $21820 to the resistance at $22050.


NASDAQ TRADING RESULT – JUNE 13, 2025📉 NASDAQ TRADING RESULT – JUNE 13, 2025 📉
Following the analysis from June 9, 2025, NASDAQ has reached the bearish target at Magnet Area (DmH4) 21524.00 on June 13, 2025.
The move started with a rejection from Magnet Area (SpH4) 21767.00 – 22067.00. As long as price remains below 21767.00, there is still downside potential toward Magnet Area (DmH4) 21136.00.
⚠️ DISCLAIMER:
This content is for educational purposes only and not financial advice. Trading involves high risk. Always perform your own analysis and apply proper risk management.


NAS - LOOKING FOR RECOVERTeam This morning we got out of beautiful SHORT on UK100
Market dumping hard due to ISRAEL'S and Iran
However we expect market to be recover during UK market opening
Please follow the price accordingly to the chart
Once it reach 1st target, take 50-70% profit reduce the volume and bring stop loss to BE
LET'S GO.


Sniper Smart money NASDAQ 🎯 SNIPER SIGNAL – NASDAQ (NAS100)
📅 Date: June 11, 2025
⏱ Timeframe: 1H (H1)
📉 Type: Sell
📍 Entry (SELL): 21,950 – 21,970
⛔ Stop Loss: 22,050
🎯 Take Profit 1: 21,700
🎯 Take Profit 2: 21,450
📊 Risk/Reward ≈ 1:2
🧠 Smart Money Analysis:
✅ Liquidity sweep above 21,950–21,970
✅ Bearish BOS confirmed on 1H
✅ H1 imbalance zone not filled
✅ RSI shows bearish divergence
✅ Order block rejection at 21,900–21,950
💬 Confirmation: await H1 close below ~21,900
🔒 Always use effective risk management
📌 Signal by: **@Talion-Promosale**
(Personal analysis – not financial advice)
#NAS100 #NASDAQ #SniperSignal #SmartMoney #TradingView #TalionPromosale

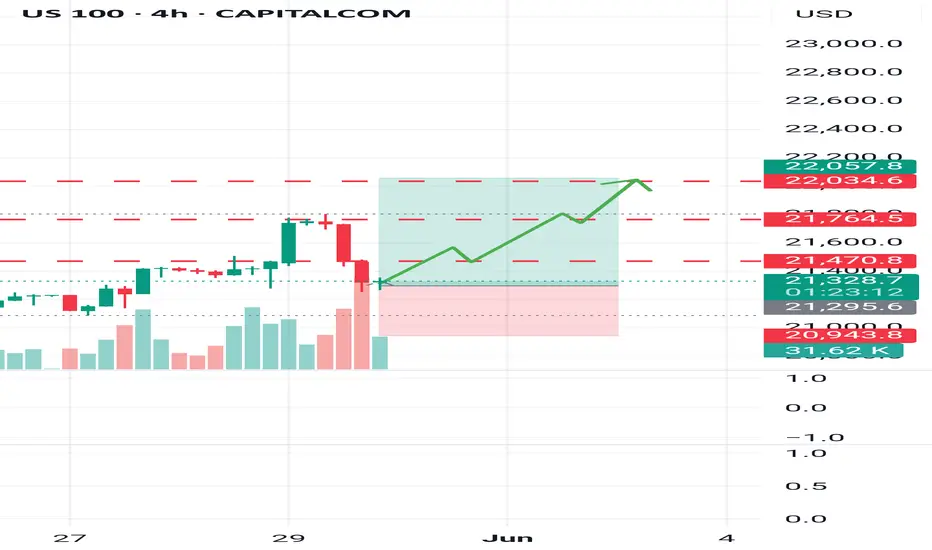
This is not a bull trap, US100 target 22kIm expecting Nas to climb after healthy pullback. You can enter now at 21319 and TP next week at 22K. If you decide to trade this idea, use a proper size. You can also average at the bottom of SL zone. TP partially at the red lines. Please check my previous ideas to know if-what are you trading. Wish you good luck.
NAS100 – Major Rejection from Weekly Supply Zone!The NASDAQ 100 is showing clear signs of weakness after tagging the strong supply zone near 21,927, an area previously respected as resistance. The market printed a bearish daily close after failing to break above, forming a potential double top pattern just below key resistance.
🔵 Key Zones to Watch:
🔼 Supply Zone: 21,765 – 21,927 (Strong institutional selling pressure)
🔽 Next Target 1: 19,185 (mid-structure support)
🔽 Next Target 2: 16,948 (high-volume demand zone)
📉 Bearish Scenario: If price continues to reject the supply area, we expect momentum to shift bearish targeting the 19,185 zone and possibly 16,948 if major U.S. economic data disappoints.
⚡ Why This Setup Matters:
Market is overstretched, showing distribution signs
Risk-off sentiment growing ahead of major economic reports
Volume profile confirms resistance overhead
🎯 Trading Plan:
Monitor for confirmation (bearish engulfing, breakdown of recent lows)
Short bias below 21,765
Watch for reaction at 19,185 and strong buy interest at 16,948 zone
📊 Let’s hear your thoughts: Will NAS100 hold or is a deeper correction coming? Comment below! ⬇️
#NASDAQ #US100 #Indices #BearishReversal #SupplyDemand #SmartMoney #PriceAction #TradingSetup #TradingView #LuxAlgo

An update on my NAS100 trade idea I shared over the weekend.I analyzed over the weekend and ended up breaking down a weak high, my mistake was not considering some of the information the chart was communicating at that time.
I ended up not getting any entry opportunity on the POI I was targeting. As I was waiting, I noticed I was looking for entry on the push of a weak high which was now acting as an inducement then reevaluated my analysis and noticed price was going to look for liquidity above that weak high.

NASDAQ Weekly Trading Strategy: Bullish Opportunities Amid Secto- Current Price: 21631.04
- Key Insights:
- NASDAQ’s mixed performance suggests an ideal opportunity for selective
trading, with robust long-term bullish trends juxtaposed against short-term
volatility.
- Traders should focus on support levels for entry and utilize resistance
targets for profit-taking. Technology stocks exhibit vulnerabilities but may
rebound if key supports hold. Tesla's relative strength over peers offers
additional momentum within the sector.
- Price Targets:
- Next Week Targets:
- T1: 22,000
- T2: 22,600
- Stop Levels:
- S1: 21,200
- S2: 20,800
- Recent Performance:
- The NASDAQ saw a -0.63% decline last week, performing better than the Dow
(-1.32%) but lagging behind the S&P 500 (-0.39%). Technology sector divergence
dominated trading, with weakness in Nvidia and Apple contrasting Tesla’s
resilience.
- Expert Analysis:
- Despite short-term challenges, investor sentiment remains optimistic based
on institutional data, provided that support levels hold firm. NASDAQ’s position
above crucial long-term moving averages suggests sustained bullish interest.
However, short-term signals warn of possible pullbacks due to broader risk
aversion.
- News Impact:
- Escalating geopolitical tensions in the Middle East contributed to increased
market volatility. Risk-off sentiment pushed investors toward safer assets like
gold and oil, impacting equity flows. As tensions persist, the market may face
heightened challenges next week.

Hanzo / Nas100 15 Min ( Accurate Tactical Break Out Zones )🔥 Nas100 – 15 Min Scalping Analysis
⚡️ Objective: Precision Breakout Execution
Time Frame: 15-Minute Warfare
Entry Mode: Only after verified breakout — no emotion, no gamble.
👌Bullish After Break : 21850
Price must break liquidity with high volume to confirm the move.
👌Bearish After Break : 21690
Price must break liquidity with high volume to confirm the move.
☄️ Hanzo Protocol: Dual-Direction Entry Intel
➕ Zone Activated: Strategic liquidity layer detected — mapped through refined supply/demand mechanics. Volatility now rising. This isn’t noise — this is bait for the untrained. We're not them.
🩸 Momentum Signature Detected:
Displacement candle confirms directional intent — AI pattern scan active.
— If upward: Bullish momentum burst.
— If downward: Aggressive bearish rejection.
🦸♂️ Tactical Note:
The kill shot only comes after the trap is exposed and volume betrays their position.

NAS100 ATH or what? optimism coming back or no? Chyna CHyna CHyNAS100 ATH or what?
optimism coming back or no? Chyna CHyna CHyna? or no CHyna? let us know~~
we caught april bottom now run ATH?
🐉We value full transparency. All wins and fails fully publicized, zero edit, zero delete, zero fakes.🐉
🐉Check out our socials for some nice insights.🐉
information created and published doesn't constitute investment advice!
NOT financial advice

NASDAQ Initiated a standard short-term Bull Cycle.Nasdaq (NDX) has been trading within a Channel Up ever since the November 2008 bottom of the U.S. Housing Crisis. The recent Trade War correction that started early this year, bottomed just before the 1W MA200 (orange trend-line) and rebounded.
As this chart shows, every break below the 1W MA50 (blue trend-line) has technically started a new Cycle. During this 16-year pattern, we have seen two types of Cycles, a short (blue Rectangle) and long (green Rectangle).
Based on the sequence since the start of the Channel Up, the index should have now just initiated its new short Cycle. Both previous ones peaked on the 1.786 Fibonacci extension before a correction below the 1W MA50 again. As a result, we expect to see 28000 at least before the next meaningful technical correction.
-------------------------------------------------------------------------------
** Please LIKE 👍, FOLLOW ✅, SHARE 🙌 and COMMENT ✍ if you enjoy this idea! Also share your ideas and charts in the comments section below! This is best way to keep it relevant, support us, keep the content here free and allow the idea to reach as many people as possible. **
-------------------------------------------------------------------------------
💸💸💸💸💸💸
👇 👇 👇 👇 👇 👇

Bullish continuation?USTEC is falling towards the pivot and could bounce to the 1st resistance.
Pivot: 21,115.24
1st Support: 20,647.83
1st Resistance: 22,217.62
Risk Warning:
Trading Forex and CFDs carries a high level of risk to your capital and you should only trade with money you can afford to lose. Trading Forex and CFDs may not be suitable for all investors, so please ensure that you fully understand the risks involved and seek independent advice if necessary.
Disclaimer:
The above opinions given constitute general market commentary, and do not constitute the opinion or advice of IC Markets or any form of personal or investment advice.
Any opinions, news, research, analyses, prices, other information, or links to third-party sites contained on this website are provided on an "as-is" basis, are intended only to be informative, is not an advice nor a recommendation, nor research, or a record of our trading prices, or an offer of, or solicitation for a transaction in any financial instrument and thus should not be treated as such. The information provided does not involve any specific investment objectives, financial situation and needs of any specific person who may receive it. Please be aware, that past performance is not a reliable indicator of future performance and/or results. Past Performance or Forward-looking scenarios based upon the reasonable beliefs of the third-party provider are not a guarantee of future performance. Actual results may differ materially from those anticipated in forward-looking or past performance statements. IC Markets makes no representation or warranty and assumes no liability as to the accuracy or completeness of the information provided, nor any loss arising from any investment based on a recommendation, forecast or any information supplied by any third-party.

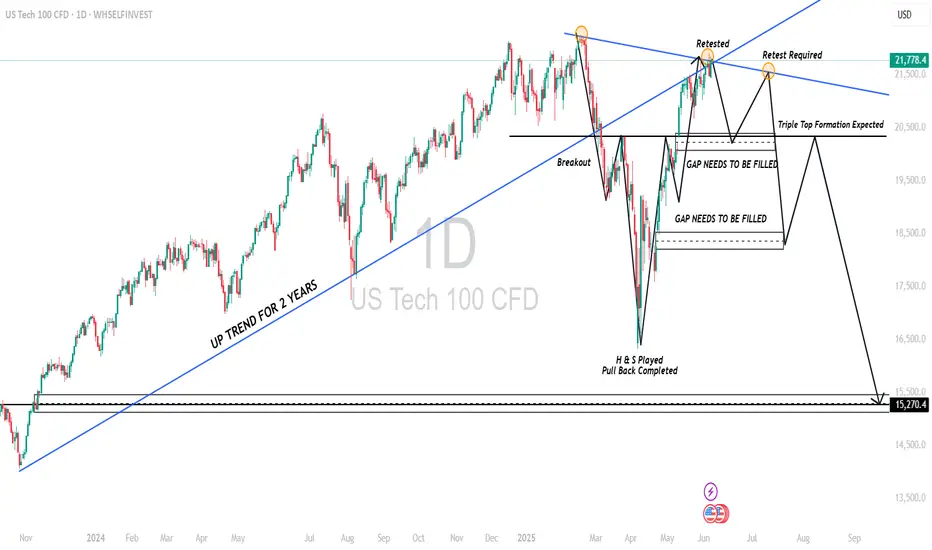
USTECH MAJOR DROP EXPECTED The price has been making higher highs and higher lows since the March 2025 low. Maybe New all-time highs about to happen but i think it's trend reversal , Next week is important if price doesn't break the trendline resistance and show weakness then i believe it's trend reversal.
NASDAQ at Weekly Supply Zone – Bearish Breakdown Ahead? (READ)By examining the #Nasdaq chart on the weekly timeframe, we can see that the price is currently trading within the supply zone around 21,400. If it manages to close and stabilize below 21,100, we can expect further downside for this index. The potential bearish targets are 21,000, 20,700, 20,200, and 19,150. The key supply zone ranges from 21,400 to 22,200.
Please support me with your likes and comments to motivate me to share more analysis with you and share your opinion about the possible trend of this chart with me !
Best Regards , Arman Shaban

US100 Weekly: Bullish Pullback or Breakdown at 21,000?
US100 – Weekly Technical Outlook
Week ending: 06 June 2025
⸻
📊 Big Picture Summary:
The NASDAQ 100 is still in a larger uptrend, but it’s facing resistance at the 22,000 level. Rejection there has triggered a short-term pullback. As long as price holds above 21,000, the bullish structure remains valid. Below that, we risk a deeper correction.
⸻
🕰 Multi-Timeframe Snapshot:
• Weekly: 21,488 | Small up-bar | Higher Low > prior | Re-testing February supply
• Daily: 21,472 | Long upper wick | Higher High | Rejected 22k supply
• 12H: 21,474 | Outside-bar pullback | Expanding | Closed into 0.382 Fib
• 4H: 21,474 | Large bear bar | Higher Low | Lands on 100 SMA
• 90M: 21,474 | Momentum flush | Lower Low | Tags 0.618 Fib + trendline
⸻
📈 Trend & Structure Analysis:
• Weekly: Strong uptrend with rising SMA stack; price above Ichimoku cloud. As long as 21,000 holds, pullbacks are buyable. Key support: 20,350–19,140.
• Daily: Uptrend intact but overextended. Rising wedge structure broke at 22k, risk of pullback to 21,070 or 20,750.
• 12H: Bullish while above 21,160, but channel loss warns of potential dip to 21,000.
• 4H: Rising wedge break confirmed; testing 100 SMA. Needs to reclaim 21,700 to resume strength.
• 90M: Bearish flush with momentum reset. Needs quick reclaim of 21,630, else risk of continuation to 21,300.
⸻
📊 Momentum & Flow:
• Weekly RSI: 58 | MACD + | CMF +0.08
• Daily RSI: 62 | MACD – | Bearish divergence developing
• 12H RSI: 55 | MACD –
• 4H RSI: 44 | MACD – | Hidden bullish possible
• 90M RSI: 35 | MACD –
Interpretation: Higher timeframes show strength but momentum is cooling off. Lower timeframes show bearish pressure, but it looks corrective, not a trend reversal—unless 21,000 fails.
⸻
📉 Volatility Overview:
• Weekly: Mild expansion, %B at 0.66
• Daily: Expansion pausing, %B from 0.93 → 0.75
• 12H: Post-squeeze contraction
• 4H: Mean reversion phase
• 90M: Lower-band flush, ready for new drive
⸻
📍 Key Levels to Watch:
• 22,200–22,900: Weekly + Daily supply zone (strong resistance)
• 21,804–21,718: Intraday bear OB (90M)
• 21,661–21,627: Bull OB on 90M – key battle line
• 21,468–21,396: 4H order block + Fib cluster
• 21,130–21,000: Major 12H support + rising trendline
• 20,750–20,420: Strong Daily demand zone
• 18,306–17,800: Weekly macro support
⸻
🔥 Confluence Hotspots:
• 22,200 – Multi-timeframe supply, channel top = strong sell zone
• 21,660 – 90M bull OB + Fib 0.382 = minor support
• 21,468 – 4H Fib + wedge retest = neutral
• 21,130 – 12H OB + trendline + 100 SMA = major support
• 20,750 – Daily demand + 200 SMA = deeper buy zone
⸻
🧠 If / Then Logic:
• If 90M closes above 21,660 + 4H prints HL → Bull continuation
• If price ranges 21,660–21,350 for 24h → Expect pause
• If 90M closes below 21,350 → Bearish extension likely
⸻
🎯 TradingView Alert Grid:
• US100 crosses 22,200 → “Weekly supply breached – reassess bias.”
• US100 crosses 21,804 → “Intraday bear OB reclaimed – review short bias.”
• US100 crosses 21,660 → “Primary bull trigger activated – watch for long setups.”
• US100 crosses 21,000 → “Critical support broken – full re-analysis needed.”
• US100 crosses 20,750 → “Testing demand – reassess buy zone.”
⸻
🎲 Scenario Odds:
• Breakout above 22,200 → 25%
• Range between 21,800 ↔ 21,000 → 50%
• Dip below 21,000 then reclaim → 25%
⸻
✅ Final Summary:
The trend is still bullish at the macro level, but we’re in a corrective pullback. As long as 21,000 holds, this remains a healthy reset.
Watch 21,130 for long setups, and 21,660 as the first reactivation trigger for upside.
If 21,000 fails, brace for deeper demand tests at 20,750 and possibly 18,800.


Hedge funds are unusually bearish and here's why...We have a huge dealing range to short into and still remain bullish, it's basically free money on technical retracement/correction while not ruining the market.
The retailers have been buying since April but there is no institutional orderflow evidenced by no peak above average volume levels.
Technicals will reign supreme here. Trump is either trolling about the rate decrease or he has no idea about chart technicals 😮💨. I bet he's trolling, as he has cabinets on cabinets of market advisors who know fully how correction cycles work.
