USNAS100 Bearish Below 21,790 – Key Levels to WatchUSNAS100 – Overview
The price remains under bearish pressure as long as it trades below the pivot level at 21,790. A continued move lower is expected toward the support at 21,635, and a 15-minute close below this level may extend the bearish trend toward 21,480.
To shift to a bullish outlook, the price must stabilize above 21,920, which could open the path toward 22,090.
Pivot: 21,790
Support Levels: 21,635 · 21,480 · 21,250
Resistance Levels: 21,920 · 22,090 · 22,200
NAS100 trade ideas

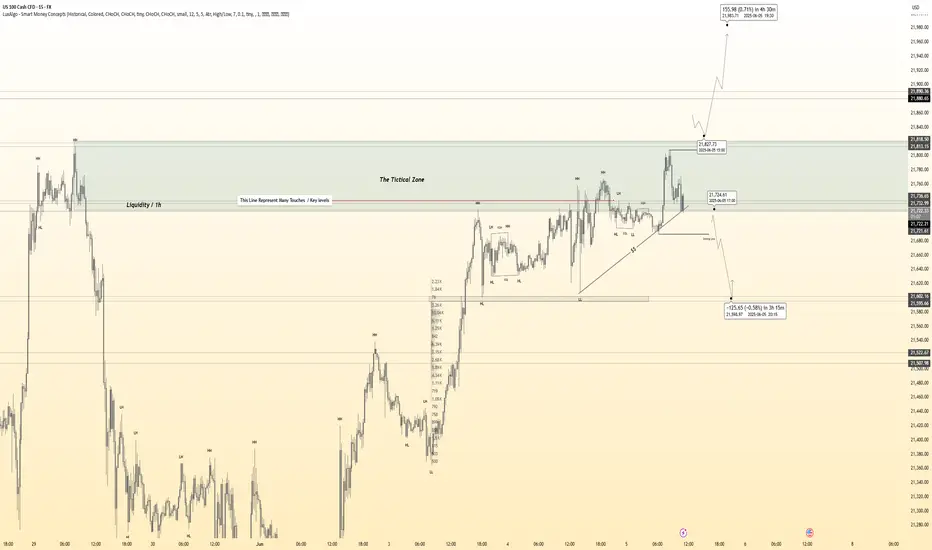
Hanzo / Nas100 15 Min ( Accurate Tactical Break Out Zones )🔥 Nas100 – 15 Min Scalping Analysis (Bearish Setup)
⚡️ Objective: Precision Breakout Execution
Time Frame: 15-Minute Warfare
Entry Mode: Only after verified breakout — no emotion, no gamble.
👌Bullish After Break : 21825
Price must break liquidity with high volume to confirm the move.
👌Bearish After Break : 21690
Price must break liquidity with high volume to confirm the move.
☄️ Hanzo Protocol: Dual-Direction Entry Intel
➕ Zone Activated: Strategic liquidity layer detected — mapped through refined supply/demand mechanics. Volatility now rising. This isn’t noise — this is bait for the untrained. We're not them.
🩸 Momentum Signature Detected:
Displacement candle confirms directional intent — AI pattern scan active.
— If upward: Bullish momentum burst.
— If downward: Aggressive bearish rejection.
🦸♂️ Tactical Note:
The kill shot only comes after the trap is exposed and volume betrays their position.
Hanzo / Nas100 15 Min ( Accurate Tactical Break Out Zones )

New High. Flat Divergence Bearish Divergence due to highs within price action with a double top on our RSI index. Ultimately we're in a large chopping block waiting to be released. If you assess SPX prior to downfall, you don't see unusual large rejections, it's progressive and it has been for a while. Safe bets... to 21,400

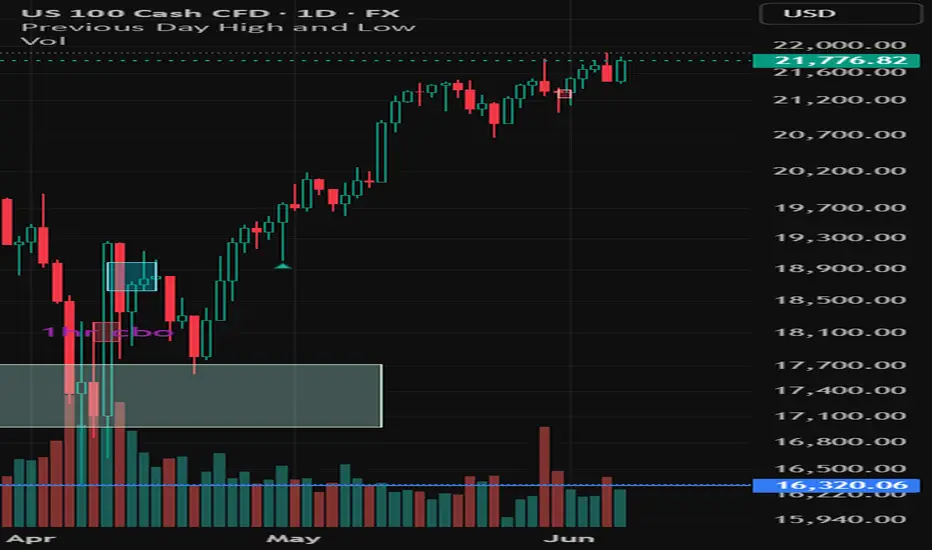
NASDAQ 100 at Heavy Supply – Time to Sell the Top?The US100 (NASDAQ) has entered a strong supply zone near 21,800, and history suggests this is no time to get greedy…
🧠 Key Observations:
Price is now inside a critical resistance area marked by LuxAlgo’s Supply & Demand indicator.
We've had multiple rejections at this level going back to March.
Momentum is slowing even as price pushes higher — divergence alert 🚨
📉 Potential Drop Zones:
21,765 = immediate resistance-turned-support to watch
19,185 = former consolidation + breakout base (likely bounce zone)
16,948 = demand cluster where bulls are likely to reload
📆 Timing Is Key:
With macro catalysts (⚡🌍📰) scheduled in the coming week — including inflation and Fed signals — volatility could spike and force a sharp move down if sellers take control.
---
📌 My Setup:
If price fails to break and hold above 21,800, I’m watching for bearish confirmation to short, targeting 19,185 short-term and 16,948 mid-term.
---
💬 What’s your take on NASDAQ?
Do you trust this breakout or is it just another bull trap?
👉 Comment below, leave a ❤️ if this helped, and follow for more chart breakdowns.

USNAS100 – Bearish Bias Below 21780 Ahead of CPI and Trade TalksUSNAS100 – Bearish Pressure Below 21780, CPI & Trade Talks in Focus
Overview:
USNAS100 remains under downward pressure ahead of a key macro week, including US-China trade talks and the upcoming US CPI data.
Technically, price remains bearish while below the pivot level at 21780.
A break below 21635 may lead to further downside toward 21470 and potentially 21360.
On the upside, a 1H close above 21780 could invalidate the bearish view and open the path toward 21920 and the ATH at 22200.
Key Levels:
Pivot: 21780
Support: 21635, 21470, 21360
Resistance: 21920, 22200


A Nasdaq Black Hole - Unprecendented yes, Impossible no Before anyone says anything...yes Elliot Waves are completely subjective BUT IMHO i have drawn these correctly....
The NAS made a violent move from 22100 down 16300 in a very short space of time. So what? It will just make another ATH right?
Well, of course. It almost certainly will, the real question is when. If this pattern plays out, it won't be in 2025.
After every impulse on any timeframe, long or short, you'd naturally expect a pullback.
However, not all pullbacks are the same. Usually, the first significant pullback for a corrective wave is no more than 50%.
However, if you have a pullback that is 61.8% or more, it is usually considered an impulsive wave.
What the difference? Corrective waves have3 waves, ultimately trending in one direction, and impulsive waves have 5 waves trending in one direction.
If the Nasdaq falls beneath 20900, with increasing volume, this will signify confirmation to me at least, that we could be starting one of the most violent impulsive bearish waves in the history of financial markets.

US100 Weekly: Bullish Pullback or Breakdown at 21,000?
US100 – Weekly Technical Outlook
Week ending: 06 June 2025
⸻
📊 Big Picture Summary:
The NASDAQ 100 is still in a larger uptrend, but it’s facing resistance at the 22,000 level. Rejection there has triggered a short-term pullback. As long as price holds above 21,000, the bullish structure remains valid. Below that, we risk a deeper correction.
⸻
🕰 Multi-Timeframe Snapshot:
• Weekly: 21,488 | Small up-bar | Higher Low > prior | Re-testing February supply
• Daily: 21,472 | Long upper wick | Higher High | Rejected 22k supply
• 12H: 21,474 | Outside-bar pullback | Expanding | Closed into 0.382 Fib
• 4H: 21,474 | Large bear bar | Higher Low | Lands on 100 SMA
• 90M: 21,474 | Momentum flush | Lower Low | Tags 0.618 Fib + trendline
⸻
📈 Trend & Structure Analysis:
• Weekly: Strong uptrend with rising SMA stack; price above Ichimoku cloud. As long as 21,000 holds, pullbacks are buyable. Key support: 20,350–19,140.
• Daily: Uptrend intact but overextended. Rising wedge structure broke at 22k, risk of pullback to 21,070 or 20,750.
• 12H: Bullish while above 21,160, but channel loss warns of potential dip to 21,000.
• 4H: Rising wedge break confirmed; testing 100 SMA. Needs to reclaim 21,700 to resume strength.
• 90M: Bearish flush with momentum reset. Needs quick reclaim of 21,630, else risk of continuation to 21,300.
⸻
📊 Momentum & Flow:
• Weekly RSI: 58 | MACD + | CMF +0.08
• Daily RSI: 62 | MACD – | Bearish divergence developing
• 12H RSI: 55 | MACD –
• 4H RSI: 44 | MACD – | Hidden bullish possible
• 90M RSI: 35 | MACD –
Interpretation: Higher timeframes show strength but momentum is cooling off. Lower timeframes show bearish pressure, but it looks corrective, not a trend reversal—unless 21,000 fails.
⸻
📉 Volatility Overview:
• Weekly: Mild expansion, %B at 0.66
• Daily: Expansion pausing, %B from 0.93 → 0.75
• 12H: Post-squeeze contraction
• 4H: Mean reversion phase
• 90M: Lower-band flush, ready for new drive
⸻
📍 Key Levels to Watch:
• 22,200–22,900: Weekly + Daily supply zone (strong resistance)
• 21,804–21,718: Intraday bear OB (90M)
• 21,661–21,627: Bull OB on 90M – key battle line
• 21,468–21,396: 4H order block + Fib cluster
• 21,130–21,000: Major 12H support + rising trendline
• 20,750–20,420: Strong Daily demand zone
• 18,306–17,800: Weekly macro support
⸻
🔥 Confluence Hotspots:
• 22,200 – Multi-timeframe supply, channel top = strong sell zone
• 21,660 – 90M bull OB + Fib 0.382 = minor support
• 21,468 – 4H Fib + wedge retest = neutral
• 21,130 – 12H OB + trendline + 100 SMA = major support
• 20,750 – Daily demand + 200 SMA = deeper buy zone
⸻
🧠 If / Then Logic:
• If 90M closes above 21,660 + 4H prints HL → Bull continuation
• If price ranges 21,660–21,350 for 24h → Expect pause
• If 90M closes below 21,350 → Bearish extension likely
⸻
🎯 TradingView Alert Grid:
• US100 crosses 22,200 → “Weekly supply breached – reassess bias.”
• US100 crosses 21,804 → “Intraday bear OB reclaimed – review short bias.”
• US100 crosses 21,660 → “Primary bull trigger activated – watch for long setups.”
• US100 crosses 21,000 → “Critical support broken – full re-analysis needed.”
• US100 crosses 20,750 → “Testing demand – reassess buy zone.”
⸻
🎲 Scenario Odds:
• Breakout above 22,200 → 25%
• Range between 21,800 ↔ 21,000 → 50%
• Dip below 21,000 then reclaim → 25%
⸻
✅ Final Summary:
The trend is still bullish at the macro level, but we’re in a corrective pullback. As long as 21,000 holds, this remains a healthy reset.
Watch 21,130 for long setups, and 21,660 as the first reactivation trigger for upside.
If 21,000 fails, brace for deeper demand tests at 20,750 and possibly 18,800.

NASDAQ 100 - Potential TargetsDear Friends in Trading,
How I see it: (Upside seems limited)
** NFP DATA RELEASE TODAY - Be safe!
Key Resistance @ 21700 - 21800
Potential Targets - "SHORT"
1] 21388.00
2] 21288.00
3] 21188.00
I sincerely hope my point of view offers you a valued insight.
Thank you for taking the time to study my analysis.

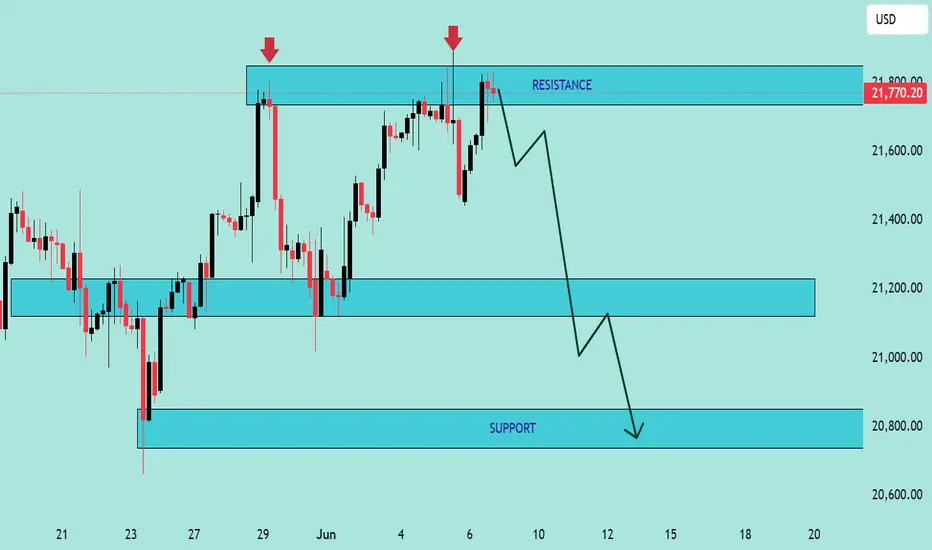
NAS100 Technical Analysis – Bearish Rejection at ResistanceNAS100 Technical Analysis – Bearish Rejection at Resistance 🚨
📅 Date: June 6, 2025
📈 Instrument: NAS100 (US Tech 100 Index)
🔍 Chart Overview:
The price action shows a clear rejection from the 21,800 USD resistance zone, marked by two strong bearish wicks (indicated by red arrows 🔴). This level has proven to be a strong supply zone, as sellers repeatedly step in to push prices lower.
🔵 Key Zones:
🔺 Resistance Zone: 21,750 – 21,800 USD
✅ Multiple rejections and bearish pressure.
🔻 Support Zone 1: 21,100 – 21,200 USD
📍 Acts as a mid-range demand zone and a potential take-profit level for short positions.
📉 Support Zone 2 (Major): 20,700 – 20,850 USD
📦 High-probability bounce area due to historical demand.
🔄 Price Action Insight:
The chart outlines a bearish double rejection pattern at the resistance level.
The current candlestick setup suggests bearish momentum, with a potential drop toward the mid-support zone.
If the price breaks below the mid-support, it could cascade down toward the major support near 20,800 USD.
📌 Projected Move:
🔻 From current levels (~21,750), expect:
Pullback from resistance,
Target 1️⃣: 21,100 USD zone,
Target 2️⃣: 20,800 USD major support.
🚫 A clean break and close above 21,800 invalidates the bearish outlook and may trigger a bullish continuation.
✅ Conclusion:
The chart favors a short bias below the resistance zone. Patience is key—wait for confirmation (like a bearish engulfing or break of structure 📉) before entering positions.
📊 Always use risk management. Set stop-loss above resistance in case of reversal.
nasdaq. a good time to sellIn my view, it’s time to sell the Nasdaq. We’ve reached new highs, and last month was the best May in over 30 years — statistically, this alone calls for caution.
Even though the economy appears strong on the surface, and market fears around DAS and Trump have faded, investors are ignoring the real issue: U.S. public debt. This is the elephant in the room.
With recent labor data pointing toward potential weakness, the risk of a major recession is increasing. If employment starts to deteriorate, the U.S. won’t be able to refinance its ever-growing debt. Trillions in interest payments are coming due soon — around $3 trillion, which is equivalent to the entire Italian public debt. The U.S. needs to roll over roughly a third of its debt, and fast.
Given all this, I don’t see any solid reason to be buying Nasdaq at current levels. It’s rallied extremely fast, and I see a retracement toward 20,000 as a realistic scenario — potentially even lower if upcoming economic data disappoints.


Down, Down Down, Down Down Down This idea tags onto my my other live idea on the Nasdaq (see my linked posts)
As we are still near the TOP as bullish euphoria is still present, I think now would be a good time to put my main POI's for the next 2 months out there:
21000
19300
11800
What are your POIs?

Hanzo / Nas100 15 Min Path ( Tactical Bearish Break Out Zone )🔥 Nas100 – 15 Min Scalping Analysis (Bearish Setup)
Bias: Waiting For Break Out
Time Frame: 15 Min
Entry Type: Confirmed Entry After Break Out
👌Bearish After Break : 21720
Price must break liquidity with high volume to confirm the move.
☄️ Hanzo Protocol: Dual-Direction Entry Intel
➕ Zone Activated: Strategic Reaction from Refined Liquidity Layer
Marked volatility from a high-precision supply/demand zone. System detects potential for both long and short operations.
🩸 Momentum Signature Detected:
Displacement candle confirms directional intent — AI pattern scan active.
— If upward: Bullish momentum burst.
— If downward: Aggressive bearish rejection.
NASDAQ - UniverseMetta - Signal#NASDAQ - UniverseMetta - Signal
D1 - Formation of a narrowing diagonal + price broke through the lower trend line through a 3-wave structure. It is better not to increase risks. Stop behind the maximum of the 1st wave.
Entry: 21509.0
TP: 20986.3 - 20372.2 - 19784.5 - 18396.7
Stop: 22160.6

My View on NAS1001. Price has been trending up for a long time.
2. A possible Reversal Pattern spotted
3. Head and Shoulder Pattern
4. Almost all elements of the Pattern have appeared
5. Refer to the Chart for entry details
6. Apply proper risk management based on your account size.
"Direction is Better than Speed"
Aliyu Gital

NASDAQ - Long now!⚡️ NAS100 15-Min Reversal Signal – Caught the Bottom?
The ELFIEDT – X-REVERSION indicator just printed a clean BUY signal on NAS100 after a strong sell-off into new session lows.
📉 Price had already extended far from structure
📈 RSI momentum began shifting and reversed sharply
✅ Volume spike and RSI reversal confluence added weight to the signal
📍 These types of signals are designed to catch mean reversion moves — especially powerful when price accelerates into extremes and the candle closes with absorption.
🎯 Remember: the signal is plotted on the close of the bar, meaning it doesn’t repaint and allows for real-time decision-making with a clear stop-loss just below the low.
💡 Watch for a potential retrace toward structure or session VWAP.

