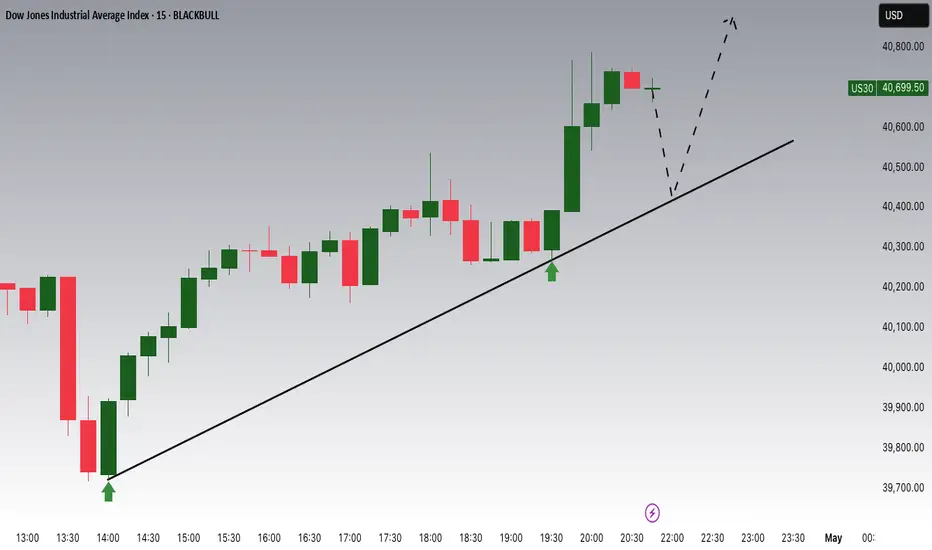
US30 - LONGWaiting for the retest all day and finally got it in after hours trading. Looking for price to continue to the upside now that we got the retest.
US30 trade ideas

Hanzo | US30 15 min Breaks – Will Confirm the Next Move🆚 US30 – Hanzo’s Strike Setup
🔥 Timeframe: 15-Minute (15M)
——————
💯 Main Focus: Bullish Break Out at 41280
We are watching this zone closely.
💯 Main Focus: Bearish Break at 40990
We are watching this zone closely.
———
Analysis
👌 Market Signs (15M TF):
• Liquidity Grab + CHoCH at 40850
• Liquidity Grab + CHoCH at 41400
• Strong Rejections seen at:
➗ 41000 – Major support / Key level
➗ 40600 – Major support / Key level
➗ 41280 – Proven resistance
🩸 Key Zones to Watch:
• 40990 – level X 6 Swing Retest
• 41270 – Strong resistance (tested 5 times) /15min
• 41000 – Equal lows
• 41400 – Equal highs

US30What is US30?
The US30, also known as the Dow Jones Industrial Average (DJIA) or simply the Dow 30, is a widely followed stock market index that tracks the performance of 30 large, publicly traded U.S. companies. These companies are considered some of the most important and influential in the U.S. economy, representing a diverse range of sectors such as technology, healthcare, finance, consumer goods, and industrials.
The index is price-weighted, meaning that stocks with higher share prices have a greater impact on the index’s value than those with lower prices. The DJIA is calculated by adding the prices of all 30 component stocks and dividing by a divisor that adjusts for stock splits and other corporate actions.
The US30 acts as a barometer of the U.S. stock market and overall economic health, though it only includes 30 companies and is not weighted by market capitalization like the S&P 500.
Companies That Make Up the US30 (As of 2025)
The 30 companies in the US30 include some of the largest and most influential U.S. corporations:
Apple Inc. (AAPL) – Technology
Microsoft Corporation (MSFT) – Technology
Nvidia Corporation (NVDA) – Technology
Visa Inc. (V) – Financial Services
Johnson & Johnson (JNJ) – Healthcare
Procter & Gamble Company (PG) – Consumer Goods
Walmart Inc. (WMT) – Retail
JPMorgan Chase & Co. (JPM) – Financial Services
The Coca-Cola Company (KO) – Consumer Goods
The Home Depot, Inc. (HD) – Retail
McDonald's Corporation (MCD) – Consumer Services
UnitedHealth Group Incorporated (UNH) – Healthcare
The Travelers Companies, Inc. (TRV) – Insurance
The Boeing Company (BA) – Aerospace & Defense
Amgen Inc. (AMGN) – Biotechnology
Goldman Sachs Group, Inc. (GS) – Financial Services
Caterpillar Inc. (CAT) – Machinery
Merck & Co., Inc. (MRK) – Pharmaceuticals
Salesforce, Inc. (CRM) – Technology
Chevron Corporation (CVX) – Energy
IBM Corporation (IBM) – Technology
Honeywell International Inc. (HON) – Industrials
Cisco Systems, Inc. (CSCO) – Technology
The Walt Disney Company (DIS) – Media & Entertainment
Nie, Inc. (NKE) – Consumer Goods
Verizon Communications Inc. (VZ) – Telecommunications
American Express Company (AXP) – Financial Services
3M Company (MMM) – Conglomerates
Walgreens Boots Alliance, Inc. (WBA) – Retail
Dow Inc. (DOW) – Chemicals
How Bond Yields and the US Dollar (DXY) Affect US30 Price Movement
Bond Yields Impact
Rising bond yields (especially U.S. Treasury yields) generally increase borrowing costs for companies, which can dampen corporate profits and weigh on stock prices, including those in the US30.
Higher yields can also make bonds more attractive relative to stocks, causing some investors to shift capital out of equities and into fixed income, putting downward pressure on the US30.
Conversely, falling bond yields reduce borrowing costs and can boost stock valuations, supporting gains in the US30.
US Dollar Index (DXY) Impact
The US Dollar Index (DXY) measures the strength of the dollar against a basket of major currencies.
A stronger dollar can hurt multinational companies in the US30 by making their exports more expensive and reducing the value of overseas earnings when converted back to USD, often leading to downward pressure on the index.
A weaker dollar tends to support US30 companies with significant international sales, potentially boosting the index.
Additionally, dollar strength often reflects risk-off sentiment, which can coincide with stock market declines, while dollar weakness often aligns with risk-on sentiment and rising equities.
Summary
Factor Effect on US30 Price Movement
Rising Bond Yields Negative: Higher borrowing costs, shift to bonds
Falling Bond Yields Positive: Lower borrowing costs, stocks more attractive
Stronger US Dollar Negative: Exporters hurt, overseas earnings worth less
Weaker US Dollar Positive: Boosts multinational earnings, supports stocks
In essence, the US30 reflects the performance of 30 major U.S. companies weighted by stock price. Its price movements are influenced by macroeconomic factors such as bond yields and the US dollar, which affect corporate profitability and investor risk appetite.

US30 (Dow Jones) – Short Setup in Play – May 2, 2025🔍 Setup Summary:
Price is trading within a bearish internal channel and has shown a reaction from a lower high inside the upper boundary. There’s clear intent to grab liquidity, possibly sweep the short-term high above the descending wedge, then reject sharply.
📉 Trade Idea:
Looking for price to spike up toward the upper channel resistance (~41,250–41,300), potentially sweep liquidity, then reject and break below the ascending trendline. A clean short could target the 15-min FVG zone and demand block around 40,600, with extended targets toward 40,300.
✅ Confluences:
Bearish market structure and channel
Potential liquidity sweep + internal market trap
Fair Value Gap + previous demand zones below
Trendline break setup for entry confirmation
📌 Bias: Bearish – short-term rally expected before a move lower
🕒 Timeframe: 15-minute chart
📈 Risk-to-Reward: 2.5–3:1 depending on entry point and target zone
⚠️ Disclaimer:
This is my personal outlook based on technical analysis. It is not financial advice. Always conduct your own research, manage risk appropriately, and use proper trade management. Markets carry risk — trade safe.


US30 is ready to push againNo comment needed. All information is in the chart analysis.
Steps to follow:
Analyze yourself.
Take the position with SL and Take Profits.
Wait, it may take a couple of days, so take a break and step away from the screen from time to time, just like I do :)
Get the result.
I will update the trade every day.
Like, comment with your good mood or viewpoint, share with your circle. It’s together that we get stronger!
Good trades, Traders!
The golden bear

Dow Jons artistic outlook - a proposition for you to take or disWhen I'm looking at my chart, i like to know what this story is about.
This is what
the whole world is looking at,
some say between 1-5 years from, now we are all going to see what it is about.
Most of us want to prosper but there is a certain minority group who doesn't want that. Why? IDK tell me that.
--------------------------------------------------
The chart do not represent a prediction of any kind its more an invitation how to start thinking -about build.
---------------------------------------------------
Time is short although my chart is on 12 month time line
=================================================
they say 1-5 years but very unlikely now. I don't know if you can see that
there is a time in next 3 years when the trend goes up.
Its my 10 years of experience i and some hard challenging times. i tracked dow nearly 24/7 for 3 years now so i know what it is about. to explain it to you in full could take some time and here is not a place to do just that.
You can see some general shapes and possible traversals, it happens i track them quite correctly due to my different mind.
"I have good intuition when I'm true to myself
this is my point of view I hope to share with you."
SimonTheBeekeeper
PS:
when things starts to move fast
i have my map to find out
where and how.
--------------
thanks for watching I


Trade Idea: Long (MARKET)Technical Confluence:
Daily Chart:
• Strong bullish engulfing recovery from recent support (~37,700).
• MACD starting to curl back up from deeply negative levels — possible trend reversal.
• RSI recovering above 50 (currently 52.49), suggesting bullish strength resuming.
15-Min Chart:
• Sustained uptrend with pullbacks respecting the moving average.
• MACD crossing positive territory.
• RSI at 64.77 with room to move higher before hitting overbought levels.
3-Min Chart:
• Tight consolidation after a sharp breakout to 40,766 — forming a potential bull flag.
• RSI at 58.89 — mid-level with upward momentum potential.
• MACD histogram shrinking — possible continuation breakout imminent.
⸻
Fundamental Context:
• Market Sentiment: U.S. markets are generally supported due to strong earnings reports and decreasing recession fears. Treasury yields have stabilized, and risk appetite is returning.
• Upcoming Events: FOMC rate decision is key — bullish bias if they hold or soften tone.
⸻
Trade Details:
• Entry: 40,770
• Price is consolidating just under this resistance. Enter on breakout with volume confirmation.
• Stop Loss (SL): 40,350
• Below recent support on the 15M chart and under the moving average. Conservative SL with volatility in mind.
• Take Profit (TP): 41,450
• Measured move from the flag pattern and aligns with Fibonacci extension and historical resistance.
FUSIONMARKETS:US30

long ideaThis Analysis Can Change At Anytime Without Notice And It Is Only For educational Purpose to Traders To Make Independent Investments Decisions.
Disclaimer
The information and publications are not meant to be, and do not constitute, financial, investment, trading, or other types of advice or recommendations supplied or endorsed by TradingView

DOW JONES: The most critical 1D MA50 of all.Dow Jones is neutral on its 1D technical outlook (RSI = 52.914, MACD = -282.250, ADX = 30.751) but has completed 5 green 1D candles in a row, going for the all important Resistance test of the 1D MA50. This trendline has been intact since March 3rd and is on a crucial Resistance cluster as this is where the LH trendline from the ATH is. The 1D RSI is already on an Inverse H&S, which is a positive sign but we need to see a candle closing over the 1D MA50 to validate the restoration of the long term bullish trend. If succesful, we will turn long and target the ATH Resistance (TP = 45,000), which is also just under the 2.0 Fib extension.
## If you like our free content follow our profile to get more daily ideas. ##
## Comments and likes are greatly appreciated. ##

US30 - AnalysisKey Levels to look for:
Resistance - 41250
Support - 40800
Currently price show a neutral trend. Resistance level must be broken for a bullish outlook as long as support is respected. A double top formation near resistance level. Failure to break this level will result in retest of support level.

US30 Stuck at Resistance – 05/05/2025🛑 US30 Stuck at Resistance – 05/05/2025 🛑
📈 Strong Bounce – But Watch This Supply Zone!
US30 ripped from the 36,700s all the way back above 41,000 🔥 — but now we’re seeing price stall just under a major resistance zone at 41,200–41,300. Bulls have full control for now, but signs of exhaustion are building 🥵.
🔍 Key Observations:
🔹 Price holding above 40,700 (key support)
🔹 41,200–41,300 = local resistance zone
🔹 42,359 = next major upside target 🎯
🔹 EMAs still bullish but starting to curve → 🌀 possible slowdown?
⚠️ Expect a squeeze or rejection play soon — market is winding up for the next breakout or pullback 💣.
🎯 Trade Plan:
🟰 Current range = 40,700 – 41,300
🔻 Lose 40,700 = retrace likely to 39,775, possibly 39,200
🚀 Break + close above 41,300 = upside open toward 42,359–42,787
🧠 Mindset Reminder:
🔁 Don’t chase highs! Wait for clean structure or rejection
⚡ When EMAs compress, expect volatility to explode
💎 Patience + plan = edge

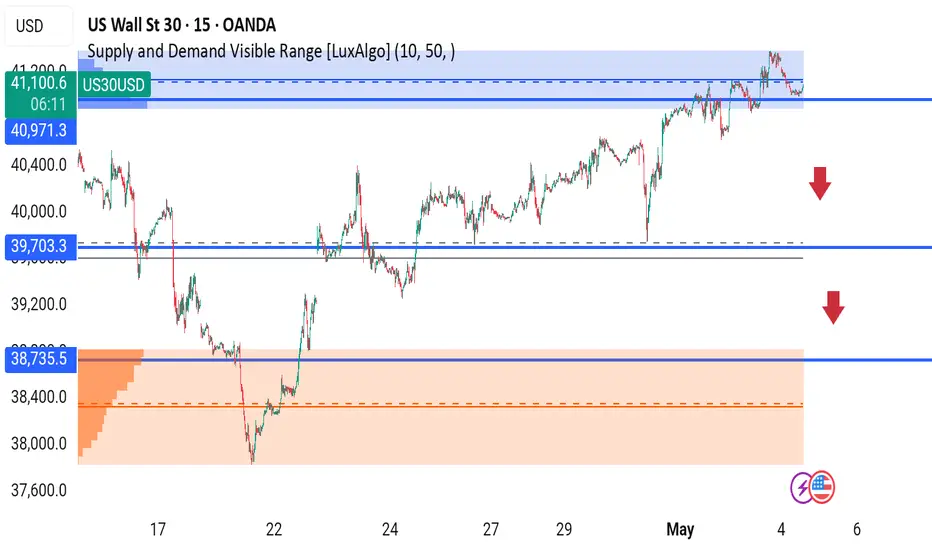
US30 – Key Supply Rejection at 41,000 | Is a Pullback ? The Dow Jones (US30) is currently trading at 41,089, slightly below the critical supply zone between 41,000 - 41,150, as identified by LuxAlgo’s Supply & Demand Visible Range. Price is showing signs of exhaustion after testing the top of the range, hinting at a potential short-term correction.
Chart Breakdown:
Supply Zone: 41,000 – 41,150 (visible resistance from recent price reaction).
Current Price: 41,089
First Support: 40,971 – the last breakout zone.
Next Support: 39,703 – major structure break level.
Demand Zone: 38,735 – 38,000 (bullish reversal zone, high volume node).
Bearish Scenario:
A clean break below 40,971 could confirm short-term bearish momentum.
Watch for price to fill the inefficiency gap toward 39,703 and possibly test 38,735 if weakness continues.
Red arrows on chart signal likely downside zones if buyers fail to defend higher levels.
Bullish Scenario:
Reclaim and close above 41,150 on strong volume may invalidate the bearish bias and push price to new highs.
Upcoming Volatility Alert:
Key U.S. economic news is on the calendar (highlighted on chart) – could cause sharp movement in either direction. Stay alert!
Trade Idea: Look for short entries around current levels with stops above the supply zone. Target the 39,703 and 38,735 levels with proper risk management.
---
Will Dow stay strong or finally give in to bearish pressure? Let me know your thoughts in the comments!
#US30 #DowJones #SupplyAndDemand #TechnicalAnalysis #SmartMoney #VolumeProfile #LuxAlgo #PriceAction #Forex #Indices #MarketUpdate


US30 Eyes 41,300: Bullish Momentum Builds for Major BreakoutTechnical Analysis: The US30 has established a strong support base at 40500, with major support at 40000 serving as a safety net. Price action shows an upward channel formation on the 4-hour chart, indicating potential trend reversal. The risk-reward ratio of 1.60 (500 points risk for 800 points potential reward) provides favorable trading conditions. Recent price action demonstrates higher lows, suggesting accumulation phase and bullish momentum building.
Sentiment Analysis: Market sentiment shows cautious optimism despite recent volatility. Institutional investors maintain bullish positions, particularly in technology and energy sectors. The AAII Investor Sentiment Survey indicates decreased bullish sentiment, which often serves as a contrarian indicator suggesting potential upside movement. Economic forecasts pointing toward a soft landing rather than hard recession support continued equity market strength.
Support and Resistance Levels: Entry zone established around 40500, supported by historical price action and recent consolidation patterns. Major support at 40000 provides clear stop loss level, limiting downside risk. Target of 41300 aligns with previous resistance zone, offering realistic profit objective before encountering major resistance at 41500. Multiple tests of support levels have created strong foundation for upward movement.
Trade Management: Entry: 40500 Stop Loss: 40000 (500 points risk) Target: 41300 (800 points reward) Risk/Reward: 1.60
Additional Considerations: Recent market correction has created oversold conditions, suggesting potential mean reversion toward higher levels. Institutional buying pressure remains strong, with increased volume on upward movements. Technical indicators suggest room for upside before reaching overbought conditions. The 2024 performance showing 12.88% gain supports continued bullish momentum.
The combination of strong technical setup, positive institutional sentiment, and clearly defined support/resistance levels presents a compelling case for longing US30 with 41300 target. The favorable risk-reward ratio and multiple confirmation factors enhance the probability of successful trade execution.

Dow Jones Wave Analysis – 2 May 2025- Dow Jones broke resistance zone
- Likely to rise to resistance level 42000.00
Dow Jones index recently broke the resistance zone between the pivotal resistance level 40815.00 (former support from March and the top of wave A from the start of April) and the 61.8% Fibonacci correction of the downward impulse 5 from March.
The breakout of this resistance zone continues the C-wave of the active ABC correction (2) from the start of April.
Dow Jones index can be expected to rise to the next resistance level 42000.00 (target price for the completion of the active impulse wave C).


DowJones INTRADAY NFP volatility trigger! Momentum is bullish, but today’s NFP report is a key risk event. A weaker-than-expected jobs number could reinforce rate cut bets and extend the rally. A surprise beat may trigger profit-taking.
Key Support and Resistance Levels
Resistance Level 1: 41200
Resistance Level 2: 42000
Resistance Level 3: 42710
Support Level 1: 39446
Support Level 2: 38490
Support Level 3: 37840
This communication is for informational purposes only and should not be viewed as any form of recommendation as to a particular course of action or as investment advice. It is not intended as an offer or solicitation for the purchase or sale of any financial instrument or as an official confirmation of any transaction. Opinions, estimates and assumptions expressed herein are made as of the date of this communication and are subject to change without notice. This communication has been prepared based upon information, including market prices, data and other information, believed to be reliable; however, Trade Nation does not warrant its completeness or accuracy. All market prices and market data contained in or attached to this communication are indicative and subject to change without notice.

US30 Trading Into Major Resistance - Look For Dow Jones Retrace🔍 US30 Analysis: At the moment, I'm watching the US30 as it looks overextended 📈 and is trading into previous highs. 🧱 If you look left on the chart, it's approaching a key resistance level on both the weekly and daily timeframes.
I’m expecting a potential retracement 🔁 and monitoring for a bearish break of structure on the 30-minute timeframe ⏱️ as a possible setup for a counter-trend short 📉 — aiming for the imbalance zone visible on that timeframe.
📏 Drawing a Fibonacci retracement from the recent swing low to high, the 50% equilibrium 🔄 lines up perfectly with the imbalance area, adding confluence to the idea.
📚 This is shared for educational purposes only and should not be considered financial advice 💼.
