US30 Eyes 41,300: Bullish Momentum Builds for Major BreakoutTechnical Analysis: The US30 has established a strong support base at 40500, with major support at 40000 serving as a safety net. Price action shows an upward channel formation on the 4-hour chart, indicating potential trend reversal. The risk-reward ratio of 1.60 (500 points risk for 800 points potential reward) provides favorable trading conditions. Recent price action demonstrates higher lows, suggesting accumulation phase and bullish momentum building.
Sentiment Analysis: Market sentiment shows cautious optimism despite recent volatility. Institutional investors maintain bullish positions, particularly in technology and energy sectors. The AAII Investor Sentiment Survey indicates decreased bullish sentiment, which often serves as a contrarian indicator suggesting potential upside movement. Economic forecasts pointing toward a soft landing rather than hard recession support continued equity market strength.
Support and Resistance Levels: Entry zone established around 40500, supported by historical price action and recent consolidation patterns. Major support at 40000 provides clear stop loss level, limiting downside risk. Target of 41300 aligns with previous resistance zone, offering realistic profit objective before encountering major resistance at 41500. Multiple tests of support levels have created strong foundation for upward movement.
Trade Management: Entry: 40500 Stop Loss: 40000 (500 points risk) Target: 41300 (800 points reward) Risk/Reward: 1.60
Additional Considerations: Recent market correction has created oversold conditions, suggesting potential mean reversion toward higher levels. Institutional buying pressure remains strong, with increased volume on upward movements. Technical indicators suggest room for upside before reaching overbought conditions. The 2024 performance showing 12.88% gain supports continued bullish momentum.
The combination of strong technical setup, positive institutional sentiment, and clearly defined support/resistance levels presents a compelling case for longing US30 with 41300 target. The favorable risk-reward ratio and multiple confirmation factors enhance the probability of successful trade execution.
US30 trade ideas


Dow Jones Wave Analysis – 2 May 2025- Dow Jones broke resistance zone
- Likely to rise to resistance level 42000.00
Dow Jones index recently broke the resistance zone between the pivotal resistance level 40815.00 (former support from March and the top of wave A from the start of April) and the 61.8% Fibonacci correction of the downward impulse 5 from March.
The breakout of this resistance zone continues the C-wave of the active ABC correction (2) from the start of April.
Dow Jones index can be expected to rise to the next resistance level 42000.00 (target price for the completion of the active impulse wave C).


US30 (Dow Jones) – Short Setup in Play – May 2, 2025🔍 Setup Summary:
Price is trading within a bearish internal channel and has shown a reaction from a lower high inside the upper boundary. There’s clear intent to grab liquidity, possibly sweep the short-term high above the descending wedge, then reject sharply.
📉 Trade Idea:
Looking for price to spike up toward the upper channel resistance (~41,250–41,300), potentially sweep liquidity, then reject and break below the ascending trendline. A clean short could target the 15-min FVG zone and demand block around 40,600, with extended targets toward 40,300.
✅ Confluences:
Bearish market structure and channel
Potential liquidity sweep + internal market trap
Fair Value Gap + previous demand zones below
Trendline break setup for entry confirmation
📌 Bias: Bearish – short-term rally expected before a move lower
🕒 Timeframe: 15-minute chart
📈 Risk-to-Reward: 2.5–3:1 depending on entry point and target zone
⚠️ Disclaimer:
This is my personal outlook based on technical analysis. It is not financial advice. Always conduct your own research, manage risk appropriately, and use proper trade management. Markets carry risk — trade safe.

US30 D1 | Bullish Continuation Based on the D1 chart analysis, the price is falling toward our buy entry level at 41,289.74, a pullback support.
Our take profit is set at 43107.01, an overlap resistance.
The stop loss is placed at 40,618.88, a swing low support level.
High Risk Investment Warning
Trading Forex/CFDs on margin carries a high level of risk and may not be suitable for all investors. Leverage can work against you.
Stratos Markets Limited (tradu.com):
CFDs are complex instruments and come with a high risk of losing money rapidly due to leverage. 63% of retail investor accounts lose money when trading CFDs with this provider. You should consider whether you understand how CFDs work and whether you can afford to take the high risk of losing your money.
Stratos Europe Ltd (tradu.com):
CFDs are complex instruments and come with a high risk of losing money rapidly due to leverage. 63% of retail investor accounts lose money when trading CFDs with this provider. You should consider whether you understand how CFDs work and whether you can afford to take the high risk of losing your money.
Stratos Global LLC (tradu.com):
Losses can exceed deposits.
Please be advised that the information presented on TradingView is provided to Tradu (‘Company’, ‘we’) by a third-party provider (‘TFA Global Pte Ltd’). Please be reminded that you are solely responsible for the trading decisions on your account. There is a very high degree of risk involved in trading. Any information and/or content is intended entirely for research, educational and informational purposes only and does not constitute investment or consultation advice or investment strategy. The information is not tailored to the investment needs of any specific person and therefore does not involve a consideration of any of the investment objectives, financial situation or needs of any viewer that may receive it. Kindly also note that past performance is not a reliable indicator of future results. Actual results may differ materially from those anticipated in forward-looking or past performance statements. We assume no liability as to the accuracy or completeness of any of the information and/or content provided herein and the Company cannot be held responsible for any omission, mistake nor for any loss or damage including without limitation to any loss of profit which may arise from reliance on any information supplied by TFA Global Pte Ltd.
The speaker(s) is neither an employee, agent nor representative of Tradu and is therefore acting independently. The opinions given are their own, constitute general market commentary, and do not constitute the opinion or advice of Tradu or any form of personal or investment advice. Tradu neither endorses nor guarantees offerings of third-party speakers, nor is Tradu responsible for the content, veracity or opinions of third-party speakers, presenters or participants.

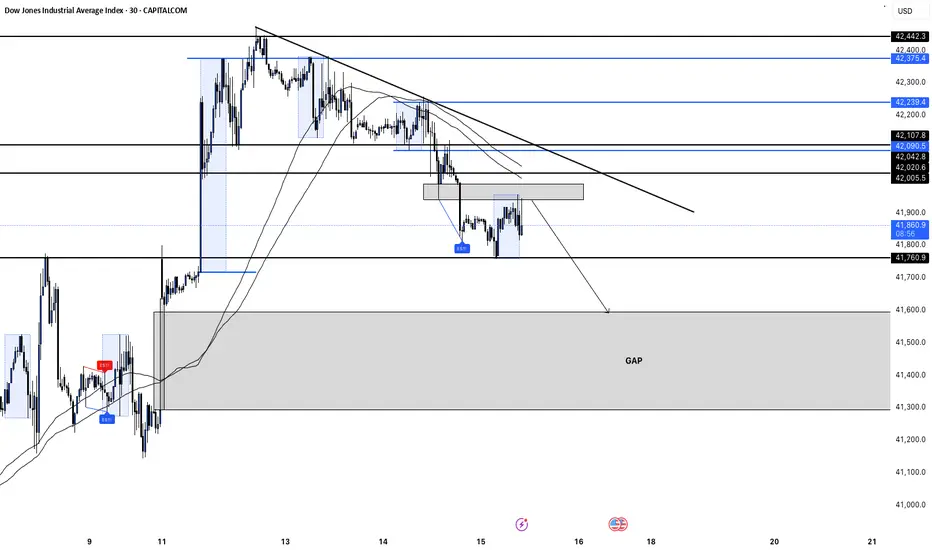
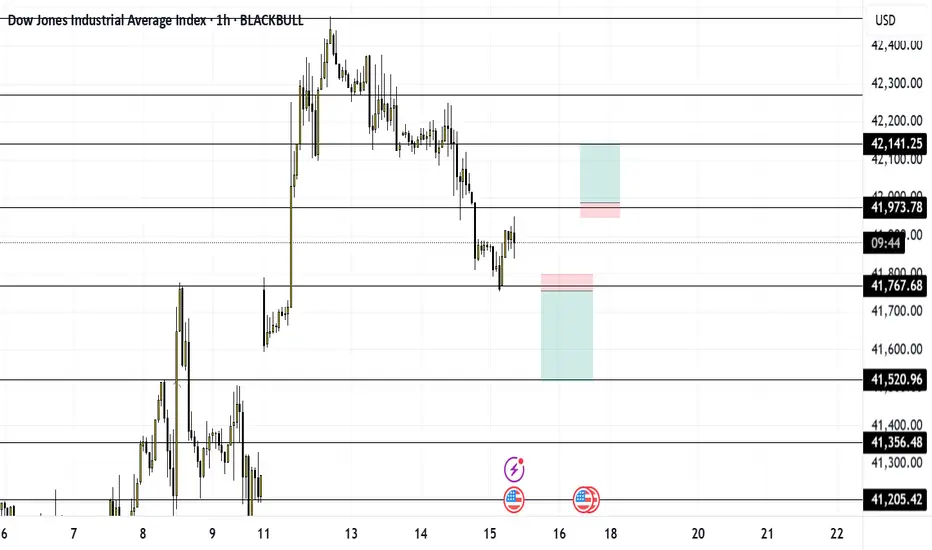
US30 MAY 15What kind of birds stick together? Velcrows! And we shall stick together as we conquer this market. Today price is stuck between 2 key areas (41,973 and 41797).
I am going to wait for price to break and retest one of those areas before I get into a buy or sell respectfully. on the 1m timeframe.
And I'm trading level to level. If it goes for the sell, it is evident that price will try to fill in the price gap that it left behind and few days ago. 41,527 level
And if price decides that it wants to go for the buy, I'll buy up to the next level where price last stopped on the hourly, 42,139 level.
But, like a 21-year-old girl, 5 shots in off of Tequilla, price will do whatever it wants, so trade responsibly. And have fun!!!
US30 Reversal Brewing? Key Demand Zone Holding Strong!The Dow is reacting sharply from a key demand zone around 41,881 – 41,905, hinting at a potential short-term reversal.
---
Technical Breakdown:
Demand Zone Held: Price bounced multiple times off the orange zone, signaling strong buyer interest.
Bullish Candles Forming: Current price action shows momentum shifting in favor of bulls.
Upcoming Target Zones:
42,145 – Minor resistance / possible take-profit for scalpers
42,398 – Major supply zone where sellers could re-enter
---
Potential Scenarios:
1. Bullish Play:
Buy above 41,905 after a solid bullish candle close
First TP: 42,145
Second TP: 42,398
SL: Below 41,860
2. Bearish Rejection (Invalidation):
If the price fails to hold 41,880 support, expect a deeper push toward 41,700 and below
---
Why It Matters:
We’re heading into a major U.S. data release (see calendar icon on chart). Volatility is expected, so watch this zone closely for a breakout or rejection!
---
What’s Your Bias?
Scalping the bounce or waiting for confirmation? Drop your trade setups in the comments below!
#US30 #DowJones #Indices #Forex #PriceAction #TechnicalAnalysis #TradingView


DowJones INTRADAY key trading level at 41790US stocks point to slightly lower open as traders react to global and economic developments.
Main drivers:
Trump’s Gulf Visit: Markets are watching for any new investment deals or geopolitical tensions. A $600B Saudi investment deal was announced yesterday, and Trump is now heading to Qatar.
Tariff Optimism: Hopes of US-China tariff easing have supported recent rallies and reduced fears of a slowdown.
Rate Cut Expectations Lower: Stronger sentiment has reduced chances of near-term rate cuts by the Fed, ECB, and BoE. This may limit upside for some rate-sensitive stocks.
ECB Outlook: ECB’s Villeroy said a rate cut is likely this summer, keeping some dovish tone in Europe.
US CPI Impact: Markets are still digesting yesterday’s inflation data, which could affect future Fed moves.
Trading Takeaway:
Momentum is supported by global optimism, but fading rate cut hopes and geopolitical risks may keep gains in check. Stay alert for headlines out of the Gulf.
Key Support and Resistance Levels
Resistance Level 1: 42550
Resistance Level 2: 42910
Resistance Level 3: 43370
Support Level 1: 41790
Support Level 2: 41470
Support Level 3: 41220
This communication is for informational purposes only and should not be viewed as any form of recommendation as to a particular course of action or as investment advice. It is not intended as an offer or solicitation for the purchase or sale of any financial instrument or as an official confirmation of any transaction. Opinions, estimates and assumptions expressed herein are made as of the date of this communication and are subject to change without notice. This communication has been prepared based upon information, including market prices, data and other information, believed to be reliable; however, Trade Nation does not warrant its completeness or accuracy. All market prices and market data contained in or attached to this communication are indicative and subject to change without notice.


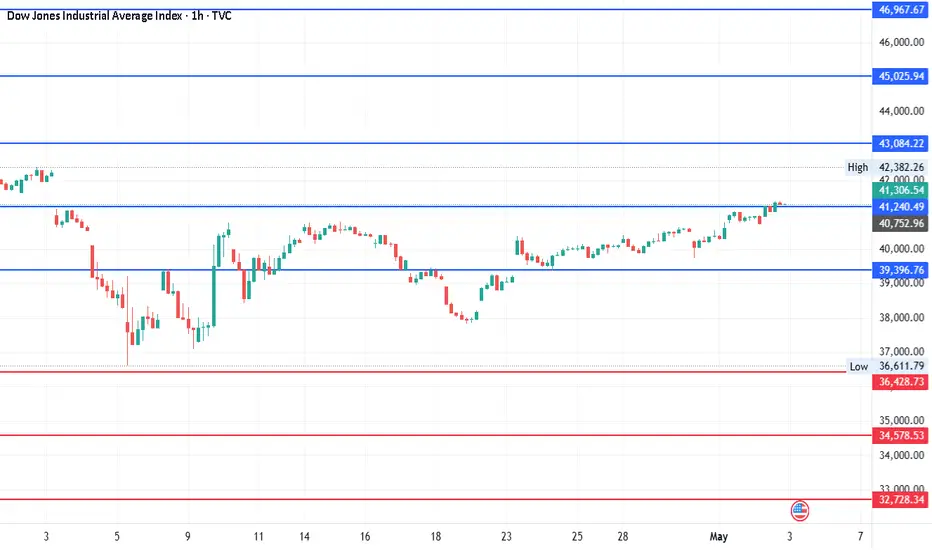
DJI - 2000 pts already moved out of 8000 pts since last posted?It has already moved around 2000 points since last posted on 22nd April. Expecting around 8000 points moved as per mentioned earlier and the levels are still the same. Introduced additional levels for the better understanding. So, another 6000 points move pending before any reasonable correction? let's see.
Upside: 41240.49, 43084.22, 45025.94 and 46967.67
Downside: 34578.53, 32728.34, 30786.61 and 28844.88
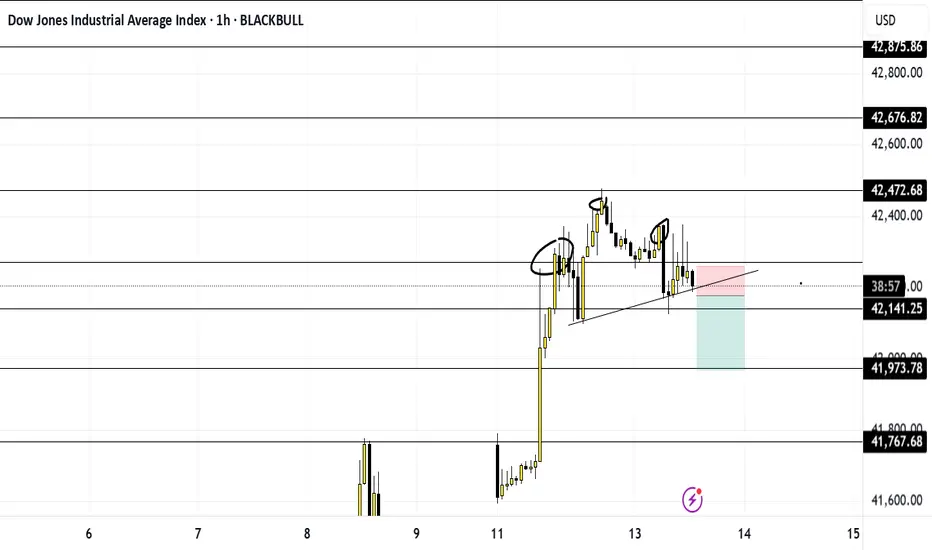
US30 AFTERNOON SESSION MAY 13Damn!! Why price acting up for? Lol let's handle it.
Price, after a very heavy push up seems as if its starting to fall off bit. Its making a head & shoulders pattern and its starting to sell. When price breaks and retests the neckline I'm going to get in for the sell and sell it down to 41970. Trade responsibly and have fun.
US30: Next Move Is Down! Short!
My dear friends,
Today we will analyse US30 together☺️
The price is near a wide key level
and the pair is approaching a significant decision level of 42,240.1 Therefore, a strong bearish reaction here could determine the next move down.We will watch for a confirmation candle, and then target the next key level of 42,166.6.Recommend Stop-loss is beyond the current level.
❤️Sending you lots of Love and Hugs❤️


Dow Jones Wave Analysis – 12 May 2025
- Dow Jones broke the resistance area
- Likely to rise to resistance level 43000.00
Dow Jones index recently broke the resistance area between the resistance level 42000.00, 61.8% Fibonacci correction of the downward impulse from February and the resistance trendline from the same month.
The breakout of this resistance area accelerated the C-wave of the active ABC correction (2) from the start of April.
Dow Jones index can be expected to rise to the next resistance level 43000.00 (former top of wave 4 from March).

