Technical and Nvidia Earnings: Key Levels and Strategic InsightTechnical Analysis
The price has stabilized within the bullish zone, targeting 20,860 and 20,990, provided it remains above 20,655.
A retest is possible within the range of 20,655 to 20,550.
For a bearish trend to emerge, the price must break below 20,550.
Nvidia Earnings and Strategic Importance
As NVIDIA (NVDA) gears up to release its third-quarter earnings, the company is projected to report $0.74 per share and generate $32.81 billion in revenue.
Key Levels:
Pivot Point: 20660
Resistance Levels: 20860, 20990, 21080
Support Levels: 20550, 20330, 20150
Trend Outlook:
Bearish below 20550
Bullish while above 20660
USTEC.F trade ideas

Morgan Stanley: Trump’s Tariff Plans Could Lower Stock IndicesMorgan Stanley: Trump’s Tariff Plans Could Lower Stock Indices
As reported by CNBC, Morgan Stanley analysts have evaluated the potential impact of tariff plans proposed by Donald Trump during his presidential campaign on the U.S. economy and stock market.
Key initiatives from the president-elect include:
→ Introducing a general tariff of 10% to 20% on all imported goods.
→ Imposing additional tariffs of 60% to 100% on imports from China.
Morgan Stanley’s Chief Global Economist, Seth Carpenter, suggests these measures could:
→ Eliminate the possibility of interest rate cuts in 2025 and constrain economic growth.
→ Threaten a slowdown in U.S. economic growth by 2026.
→ Drive inflation higher.
→ Pressure industries such as automotive, consumer electronics, machinery, construction, and retail. Increased producer costs are likely to be passed on to consumers.
These scenarios imply a negative outlook for the U.S. stock market. Tariffs may reduce investment appeal and raise borrowing costs for companies, potentially dampening market performance.
How Might This Affect Indices Like the Nasdaq 100 (US Tech 100 Mini on FXOpen)?
Technical analysis of the Nasdaq 100 chart (US Tech 100 Mini) indicates:
→ A broad upward channel has formed in 2024 (depicted in blue).
→ During October, prices gravitated toward the median line, creating a narrower channel between Resistance and Support levels.
→ Around the presidential election, prices spiked to a peak on 11 November but subsequently returned to the median.
The 21,000 level has emerged as a significant resistance point. It briefly acted as support, but the price failed to hold above it. Could bears successfully break away from the median's pull?
So far, the chart shows no clear signs of bearish activity. However, should such signals arise, they would lend greater weight to Morgan Stanley’s forecasts.
This article represents the opinion of the Companies operating under the FXOpen brand only. It is not to be construed as an offer, solicitation, or recommendation with respect to products and services provided by the Companies operating under the FXOpen brand, nor is it to be considered financial advice.

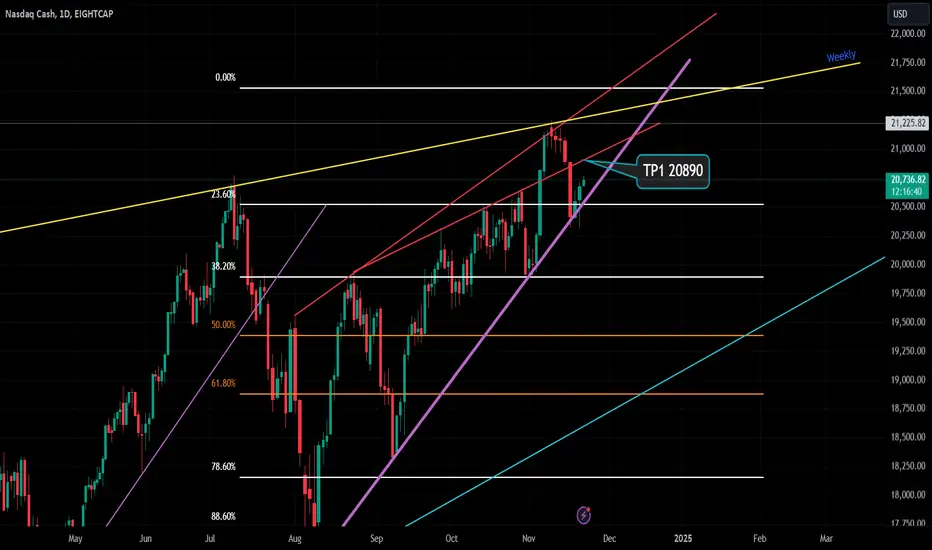
Towards 20890 but what will happen after?!The index retraced to upside once it went down top the daily uptrend line in purple, and is on the way to hit 20890 or a bit more but I would say the safe side is at that level. But what will happen after, I can not predict it as of two reasons, first we are still on pre market time, second, that I can not predict how the investors will react to the Nvidia earnings and revenue report which will be announced tonight, which I expect it will come so positive due to their new smart fast chip! but sometimes the report could be so positive but reaction could be negative though and some other times reaction could be so bullish! third, because I can not tell now if the index will retrace back to the purple daily uptrend and break it down or break the red downtrend line above and settle on then will push up harder to try to retest the weekly top downtrend line! So that day could be so volatile at market opening or one hour after and especially on the second day opening as you could see a daily gap due to the power of that report and how a heavy value stock could influence all AI sector.
Good luck all
Note! also worth to say that the bullish harami pattern which happened at the purple uptrend line followed by a green candle spinning top are also great support to push Nasdaq to 20890 and they acted as trend reversal. so my target is the high of the last daily bearish candle. but then i will see what could happen at another trade.
My ideas are exclusive to myself only and is not regarded as an advice for traders or investors and are not more than personal thoughts which I just wanted to share with you all and I do hope they could help.
I am not selling any signals and I do not take money favour any trades recommendations. They are free of charge all lifelong but I keep the copy rights of them though to not be copied or shared or sold.
The Rally May Run Out of SteamFundamental Background
According to CNBC, analysts at Morgan Stanley have conducted a study on how the tariff plans announced by Donald Trump during his campaign might affect the U.S. economy and the stock market.
Among the initiatives of the president-elect:
Implementing a general tariff of 10% to 20% on all imported goods;
Introducing additional tariffs of 60% to 100% on goods imported from China.
According to Seth Carpenter, the chief global economist at Morgan Stanley, such plans:
May eliminate the possibility of interest rate cuts in 2025 and also limit economic growth;
Threaten to reduce U.S. economic growth by 2026;
Will lead to increased inflation;
Will put pressure on the automotive industry, consumer electronics, machinery, construction, and retail sectors. It is expected that the costs to manufacturers will be passed on to consumers.
Consequently, this implies a negative outlook for the U.S. stock market as there is a high likelihood that the tariffs will reduce investment attractiveness and increase the cost of borrowing for companies, negatively impacting the stock market.
Technical Analysis
In 2024, the price formed a broad ascending channel (shown in blue);
Throughout October, the price was "magnetized" to the median line and formed a narrower channel between the Resistance and Support lines;
Against the backdrop of the presidential elections, the price surged to a peak on November 11th, but then returned to the median line.
The line around 20,941 level briefly acted as support, but the price failed to sustain above it. Could the bears' attempt to break away from the median line's pull be more successful?
Cyclical Analysis
Cyclical Chart Predicts a Decline in the Nasdaq Index
Conclusions
While the chart currently shows no clear signs of bearish activity, the facts presented above suggest that the vigorous bull market observed throughout 2024 may run out of steam.

NASDAQ BUY/SELLif the market breaks out from previous high 20759.0 market will continue to the upside until 21174.3
if the market fails to breakout from high then entry will be 20697.7 after a breakout candlestick followed by bearish engulfing candlesticks then a sell until 20120.8

Nas100 20nov24London killzone manipulated above asian session highs, sweeping liquidity and testing the supply of a 1H order block and is respecting, i am anticipating strong bearish price action.

Nas100 20nov24London killzone manipulated above asian session highs, sweeping liquidity and testing the supply of a 1H order block and is respecting, i am anticipating strong bearish price action.

The #1 Reasoñ NASDAQ 100 Will Trend UpI have been running in my doubting
About my Trading strategies..
Because sometimes that market 📈
Volatility makes it difficult to trust a system.
But you have to remind yourself that everything takes time especially when dealing with equity stocks
Again full disclosure Am mostly a Bitcoin Trading Expert
Because its easy for me to buy Bitcoin I kind of mirror my Trading strategies to pick stocks to trade.
But there is down side..low margin below x5
Meaning for every stock to trade do not use more than 5x leverage
Because the volatility will cancel you out your position.
Think of these trades like investing.Swing trading is not day trading.
In order to day trade you need to subscribe to monthly payment services such as newsletter, or TradingView
These services will allow you to dive deep into your trading journey so that you can learn how to make money quickly.
These trades I show you are swing or investment strategies.
On average you hold for about 3 months.
It's not easy but it's good for beginners.
This is why CAPITALCOM:US100
Is a good buy because it's price
correlation is connected to Bitcoin COINBASE:BTCUSD
I must warn you.There are a lot of short sellers pilling into Bitcoin.Because they think it will crash ⬇️
Bitcoin won't crash instead it will go up!
Also this chart is following the rocket booster strategy check it out.
From the resources below ⬇️
Rocket boost this content to learn more.
Disclaimer ⚠️ Trading is risky please learn risk management and profit taking strategies because you will lose money wether you like it or not.
Please
Learn More by using a simulation trading account before you use real money

NAS100 Top-Down Analysis and Weekly Outlook1. Price Structure and Market Phases
Accumulation Phase (Phase A to Phase C)
The price has been moving through an Accumulation Phase, characterized by:
Selling Climax (SC): The lowest price level where selling pressure exhausted, marked near 20,254.0.
Automatic Rally (AR): A reactionary upward move after SC, reaching approximately 20,650.5, signaling temporary buying interest.
Secondary Test (ST): A retest near the SC zone to confirm the support region before entering Phase B.
The structure is building strength, with low-volume tests (ST in Phase B) hinting at preparation for a potential breakout.
Phase B: Building Cause
Within this phase, the price oscillates in a range, indicating institutional accumulation. Key highlights:
Support line is established at 20,322.1 (also near the SC zone).
Resistance Line appears around 20,880.0, which aligns with Fibonacci retracement and psychological levels.
2. Key Price Levels
Support Levels
20,322.1: A major support level and the lower boundary of the current accumulation zone.
20,254.0: The absolute low (SC) and the invalidation point for a bullish scenario. A breakdown here would confirm a bearish continuation.
Resistance Levels
20,880.0: The upper boundary of the current range and a critical zone for a potential breakout.
21,245.7: A key invalidation level for Wave 1, which marks a shift to a new upward structure if broken.
3. Volume Profile Insights
Point of Control (POC)
20,257.1: The POC from the horizontal volume profile, indicating the area of highest trading activity and likely a magnet for price.
Volume Distribution
Low-volume pockets near 20,322.1 to 20,254.0 suggest minimal resistance if the price falls, while heavier activity near 20,650.5 may act as resistance during retracements.
4. Fibonacci Levels and Key Retracements
Fibonacci Extensions and Retracements
0.618 Retracement (20,853.3): Marks a shallow correction point and a likely resistance zone for bearish pullbacks.
0.5 Retracement (20,749.9): Frequently observed as a support/resistance level during corrective waves.
0.382 Retracement (20,650.5): Short-term support/resistance where minor reactions are expected.
5. Price Action and Market Structure
Wave Analysis
Wave ii and Wave iii are actively forming. The price is currently in a corrective Wave iv, which is shallow and aligns with Fibonacci retracement zones.
A projected Wave v is expected to test the 20,880.0 - 21,033.5 zone, which aligns with resistance from the volume profile and Fibonacci levels.
Breakout and Retest Levels
If the price closes above 20,880.0, it may signal the beginning of a larger upward move into the distribution phase or bullish SOS (Sign of Strength).
Failing to hold above 20,322.1 will increase bearish momentum, invalidating the bullish accumulation.
Change of Character (CHoCH)
The first CHoCH has already occurred with a higher low forming at 20,254.0, confirming potential bullish intent.
A higher high above 20,880.0 will further confirm the bullish transition.
6. Invalidation and Risk Management
Bullish Invalidation
A breakdown below 20,254.0 negates the bullish outlook and suggests continuation of the downward trend.
Wave Invalidation
Wave 1 invalidation is set at 21,245.7. A failure to reach this level while respecting corrective wave structures indicates bearish exhaustion.
7. Projected Scenarios
Bullish Case
The price will form a higher low near 20,322.1 and break resistance at 20,880.0, targeting:
21,033.5 (Wave v extension).
Further upside toward 21,245.7 if momentum continues.
Bearish Case
Failure to hold support at 20,322.1 will trigger a retest of 20,254.0, possibly leading to:
A breakdown into lower lows, invalidating the accumulation phase and extending the downtrend.
8. Trading Implications
Buy Zone
Near 20,322.1, as this level aligns with support and signs of accumulation.
Confirmations of bullish reversal around 20,650.5 and 20,749.9 are potential entry zones.
Targets
Short-term: 20,880.0.
Medium-term: 21,033.5 to 21,245.7.
Stop-Loss Levels
Below 20,254.0, as this invalidates the bullish scenario.
Sell Opportunities
At resistance levels (20,880.0, 21,033.5) if the price shows rejection and bearish reversal signals.

1:1 RR ,NAS100 1:1 Trades are slowly becoming my favorite , They are fast and instant rewarding motivating you and also good for developing your system . I would recommend this to any upcoming trader , A Win is A win no matter how small it is

What's Happening With Nasdaq100So as y'all know nasdaq had a big correction this year and in the same year a new ath (all time high). However, her structures are very chaotic hence the back n' forth compared to previous years.
She’s struggling at the 11th if july previous resistance and if broken then we up if not, the fall to balance things might just be a possibility. There's a trendline channel she's still in and it has been tested a lot. A 20800-850 break is all we need.
new maintained support at: 20316.
What's your take?

Nasdaq Market Review: 20-NOV-2024Good morning, everyone! Today's Nasdaq analysis is designed to educate and empower. Use these insights to refine your price action trading strategy.

Technical and digital analysisWe notice that we are in an upward correction and there is an increase in momentum. We are waiting for sellers to weaken in order to buy, Update idea Add note

Technical and digital analysisWe notice that we are in an upward correction and there is an increase in momentum. We are waiting for sellers to weaken in order to buy, Update idea Add note

NAS100USD: Bullish Setup with Key Support Zones in FocusGreetings Traders!
Current Outlook📊:
NAS100USD is displaying bullish institutional order flow, signaling a strong upward trend. Following this momentum, I am focusing on buying opportunities to target the liquidity pool at the swing high.
Key Confluences🔗:
Support Zone : Price has retraced into a significant area marked by the alignment of a mitigation block and a Fair Value Gap (FVG).
Scalping Potential : This zone serves as an institutional support area, offering confidence to seek confirmation entries for bullish setups.
Feel free to share your analysis, discuss insights, or ask questions below in the comments. Let’s learn and grow together!
Best Regards,
The_Architect

Technical and digital analysisWe notice that we are in an upward correction and there is an increase in momentum. We are waiting for sellers to weaken in order to buy, Update idea Add note

USTEC rose after avoiding Lutnick as a Treasury Secretary
The Nasdaq index has surged, fueled by solid expectations surrounding Nvidia's Q3 earnings and the alleviation of uncertainty following the appointment of the new Treasury Secretary.
Investors are breathing a sigh of relief as Howard Lutnick, a staunch supporter of Trump's tariff policies, has been nominated for Commerce Secretary rather than Treasury Secretary. In contrast, Kevin Warsh, who is running for Treasury Secretary, has openly criticized protectionist measures such as tariffs. This shift has heightened expectations that some economic issues stemming from Trump’s tariff policies will be mitigated.
Furthermore, Wall Street consistently raises Nvidia's target stock price. Investors anticipate that Nvidia's Q3 earnings will surpass market consensus, and Wall Street confidently anticipates that the Q4 guidance will also exceed expectations.
USTEC briefly tested the support at 20300 and rebounded to 20770. The index sustains upward momentum, holding above the trend line. If USTEC sustains its upward trend above the resistance at 20700, the index could gain upward momentum toward the 21250 high. Conversely, if USTEC fails to hold above the trend line and 20300, the index may fall further to 19950.

Long us100 :Oafter my in-depth analysis on the whiteboard and in private notes, it appears that there is a high probability of high growth for us100. I estimate it at 81% with my team mc.
be careful of traps!
This is not investment advice.

USTECCurrently monitoring USTEC for a break of significant levels. Awaiting clear confirmation before taking action, as this could signal a potential trend continuation or reversa

Trade on NQTrade on NQ( using similar of cash CFD) after a big bull rally, I’m entering this trade looking for a 1:5 rr, also expecting a big red day tomorrow

Nasdaq Intraday Review - Tuesday 19 Nov 2024I trade Nasdaq exclusively
Trading in GMT time zone
Sharing my post day review and analysis in case it can help you!
Did my analysis at +- 5:30 am GMT (00:30 am EST)
Economic news - None
News - None. Tomorrow is Nvidia Earnings release
Directional bias - BUY (read yesterday's post entitled "Nasdaq Intraday Review - Monday 18 Nov 2024" for more insight into today's directional bias and swing trade entry)
Yesterday I opened a swing trade at the B. hand icon.
My mental stop was placed at the thick pink line.
Wow....what a day, what a draw down!
But held throughout and I am now 1'300 pips in the profit with a big position and secured at entry i.e. trading risk free.
Here's the reasoning for holding and also where I would have entered today if I had not had a swing trade going:
Holding swing trade:
As is evident from the 1H chart, a huge red candle closed below my mental stop. In normal trading i.e. day trading I would have closed my trade.
But in this instance I entered a swing trade based on the 4H TF. On normal day trading days, I enter on much lower TF and judge how candles close against my mental SL on much lower TFs.
As a rule, if candles start closing below my mental stop, I would close.
But over the years I have also learnt that the time frame you enter on, is the TF you should judge if you want to close your trade. In other words, if I enter on a 4H TF, then in theory I should only close my trade if 4H candles start closing below my mental stop. This is very hard (especially because Nasdaq that can spike thousands of pips at a time). But over the years, as I have grown my account and gained experience, I have been able to hold fast on this observation.
And so, as can be seen on the 4H TF, a 4H candle did not close at my mental stop.
This draw down had me sweating bullets and if I had my position sizing wrong I could easily have bust my account on a 2'700 pip drawn down (esp because I trade with a 500 leverage). I was also nearly in panic mode because the news is full of stories regarding the Ukraine Russia War escalation. So I am pleased that I held my cool, stuck with my trade plan and didn't panic close my position at a massive loss.
Whether it was luck or truly my past "observation", I thank my lucky stars that price ultimately went my way.
Entry point for today:
I did not add another position today because my exposure was already at the max.
But if I hadn't had my swing trade going, I would have entered on the 1H TF at the smiley icon (because the move down was really strong, so I would have looked for confirmation on a higher TF)
Also the 1H DB formed on the strong Weekly support.
Now we need to see if price can break through the strong sell fib levels and I am hoping Nvidia earnings will help with that.
Hope you had a good trading day! Over and out!
P.S. Note how price exactly respected the market pattern profit target theory market at C. (i.e. that price will move the same distance as the height of the market pattern, once the market pattern in broken). Price formed a rising wedge on the 4H TF and then broke downwards and moved the exact distance down as the height of the market pattern.
Abbreviations:
TF = timeframe
TP = take profit
1H = 1 hour
4H = 4 hour
D = day
W = week
M = month
S&R = support & resistance
H&S = head & shoulders
EMA = exponential moving average
SL = stop loss

US 100 live tradeUs 100 live trade, I target the previous weeks high, & as a stop I use the today low.

US100 -bias long Bullish indications:
Inverted hammer candle from support in day time frame.
Major support respected.
trend line resistance broken.
MA followed the trend.
Resistance broken at 20595
Trade plan bias long @ 20608
SL:20534
TP1:20673
TP2:20739
