Facts about BTC price in next MonthsBITSTAMP:BTCUSD
I've been looking for a harmonic connection between halving dates and bitcoin price to predict next BTC price for long term. i studied some of good analysts charts and saw the price movement in some curved channel.
Thanks to Fibonacci sequence i could find some accurate connections and found below facts:
A = 1 fib. time period is ~180 days in BTC weekly chart (6months)
B= 6th Jun 2011 is the start for counting fib. time zones.
C= after each halving we have 2 major levels which one of them is the peak. it happens right at the next fib. time zone after halving *
D= first price level will be 87% of the next peak retracement (fib.). *
E= first level will be next market bottom price of next peak. this can give us the next peak !
* it exactly happened in last 2 halving with super high accuracy.
+ Green vertical lines are fib. time zones.
+ Black vertical lines are halving dates
+ Blue horizontal line are fib retracement of the main after halving wave.
this means we can see bitcoin price in November 2021 at 90000$.
Share your ideas.
BLX trade ideas

The MOST important Chart For $BTCFriends, I hope you are having a wonderful Wednesday. I wanted to combine two aspects of separate charts that I have posted before, but never together. The attached chart is the MOST important chart for determining long term trend and also determining EACH cycle top and EACH cycle bottom. The TA is simple, but incredibly powerful! It combines the Logarithmic Growth Curve with the .786 Fib drawn from EACH Cycle low since $BTC began. What it reveals is amazing! Each cycle top and cycle bottom has been contained within this all-important multiyear chart. Not only that, but EACH Fib drawn from the prior Bear market low, predicts the following Bear market low! EACH low on every cycle bottom has had its MONTHLY candle BODY close OVER the .786 Fib. PERIOD.
While I have excluded oscillators, the oscillators also Bottomed at the EXACT SAME spot.
BOTTOM LINE: The Bitcoin Low IS IN! While we might see a shallow pull back from our Adam & Eve Breakout, the path over the coming months is HIGHER!
What Invalidates this Bullish Narrative? Simple.
A break below the .786 Fib on a MONTHLY close, AND a break of the long-standing logarithmic growth curve. It is another reason why any Bull hoping for a drawdown to $10-$13K is wrong footed (technically speaking). For if that were to happen, that area would NOT be THE LOW, It would be a mere Pitstop to sub $5,000. In all fairness, I expect $BTC to eclipse $100K this cycle, BUT after we top, we will Break this repetitive cycle and $BTC, like stocks, will crash.
Have a Productive and Profitable Day Friends!
Josh


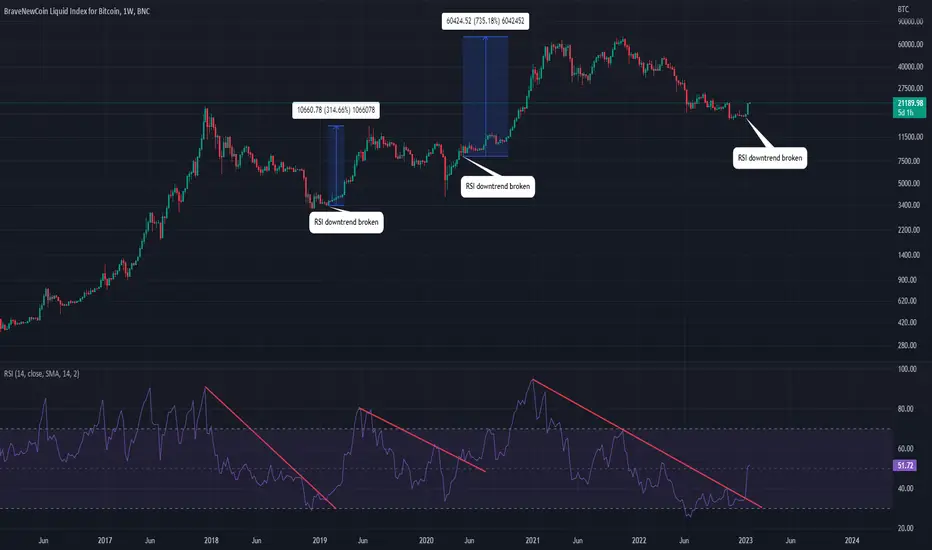
BTC - Weekly timeframe looks bullishBTC has just recently breached its 2 year downtrend on the RSI. This is a very bullish indicator for the longer term. If we look back at 2018 we can see the RSI had a similar downwards sloping trendline that when broken led to a 300%+ pump. The second time this happened was during 2020. We had our downwards sloping trendline, broke above it and flipped it into new support before going on a 750%+ rally. Current day, we have just broken our downwards sloping trendline and have already almost pumped 40%. This does not mean we cannot have a retracement in the short term, but from a weekly perspective the bottom looks like it is in!
BTC possible APEX point short-termBitcoin is doing a great job from the beginning of 2023. It broke several resistance levels allready and it's heading now to a very important one of $24383. At that point there is a Resistance and also a trendline which has to broken. Possibly around 23.5-24.3K we go back to around 21K and even back to 18.8-19K which is healthy.
the pattern I draw in is not more then just to show that we have higher highs and higher lows allready several time that gives us more strength to the upside.
With a little fantasy we can see a cup forming also which could mean we need just the "handle" to complete.
Our premium members received the first buy tip in the beginning of October and the second at the end of December which gives us a perfect Dollar Cost Average on Bitcoin.

BITCOIN - The past and its tracesHello friends!
I'm Gustavo Corrêa and I'm going to bring some of my modest reading about the future of BTC.
Let's separate the chart into two parts: 1- Cycle 2017 - 2019.
2- Cycle 2021-until now.
Note that there appear to be 4 events in these 2 cycles, identified in the sequence graph.
1- In the first cycle we see that the price worked under an LTB and above a support line. At first there was a breakout above the LTB, but it failed.
Shortly after it fell sharply below the support line. 45%. After that, a new price run began.
2- Now see the similarity with the second cycle to the right of the graph.
We have prices doing exactly the same route with the same dynamics. At the moment we are in movement 3, where there was a fall of the same 45%.
The question that remains is? Are we going to have a new bull run from here?
The truth is that we don't know, but human behavior always repeats itself and it is possible that the same thing will happen.
What do you think? Comment down below and leave your boost to support my humble work!


Bitcoin & DXY weekly - EMA20🟢🔴Bitcoin weekly needs to stay above EMA20 with constant bounces🟢while DXY should get rejected 🔴and find another leg down👀
That might lead to a bullish rally 2023
Let me know your thoughts in the comments🤗
⬇️⬇️⬇️
Likes and Follow for updates appreciated🤗
Disclaimer:
Not financial advice
Do your own research before investing
The content shared is for educational purposes only and is my personal opinion


Bitcoin From 2010 to 2025: A Bullish Corrective WaveA follow-up to my pervious invalidated long term idea of BItcoin reaching $3,000,000 within the next decade..
(to state it explicitly, this idea has largely been invalidated by further review of Bitcoin's macro price action).
This idea will be largely contrary to my previous. Based on a number of subtle signals discovered through Bitcoin's price action review, I feel at liberty to say that there's is no way that BTCUSD is structured in an Impulsive Wave format. Its expeditious growth has not once made a sizeable enough correction to satisfy a Wave 2 requirement - not one time. Generally, we expect Wave 2 to retrace at least to the 50% fib level, the most we've seen for Bitcoin (on the fib scale is 38%).
Corrections to the 38% fib level are very commonly seen within Wave B (or Wave X) in certain cases. Whether it be Wave B or Wave X, these fractals only come within corrective wave forms. Zig-Zags (the most common corrective wave type) notoriously travel much faster than Impulsive waves as well. At its current price level, BItcoin has grown 1969928%, in a matter of 13 years. We could easily classify this as a 'much faster' pump than we've seen outside of the OTC Market.
Not to drag this write-up out too long as all of my notes and thoughts are shared on the chart but let this be the main point(s):
1) Bitcoin is 1000% not in an Impulsive Wave structure.
2) In the traditional sense of price action, Bitcoin has not built any horizontal base.
3) Bullish corrective waves typically retrace 61.8%-89% on average.
Seemingly in a Bullish Double Zig-Zag wave, I believe Bitcoin has enough gas left to reach towards $174,017.93 to $329,945.48. I suspect this target range could be reach between November 2024 and March 2025 however, beyond this phase Bitcoin should/could be due for another (more drastic) Crypto Winter. Based on the rules and guidelines of Elliott Wave Theory, I believe the downside target could very well drop below $10. At worst case, it becomes the next Luna-Bomber! Permabulls, Diamond Hand(ers) and HODLers should mentally condition themselves to protect capital and to remain loyal to the same.
*Current upside and downside targets are based on the idea that $15,501 will continue to hold as the regional low. If this low is broken, the idea of a new-ATH is invalidated and bottom targets could come much quicker but, its impossible for the longstanding structure of Bitcoin's chart to be changed. This should be my last post on TradingVIew for Bitcoin. Surf well!

A Booom ahhh, cognitive count Strong B happens when A is three waved because it feels like completion of a zig zag and an end to correction, herding behavior
Normally the herd can't identify the A and they buy a long term position and In case of btc a flat can probably have the same effect, cognitively
I will not be surprised to see btc at a new low because structure based wave count has that on the table then B, of course for my level of skill however I think we are in the B of a zig zag and B might end higher than ath, flat for flat?!!
To know why the first flat is a wrong one check the related idea
Patience is virtue of kings
If you know a very good book for golden mean and Elliott wave count then introduce me ...

Mega Bullish Price Forecast for BitcoinA lot of people thinking Bitcoin follows some form of a logarithmic growth curve. That is very possible, but if you look at the chart of Apple stock we can see that it did as well for several decades before it actually broke out to the upside.
I think it's very possible that some shift in world monetary policy, such as a currency or currencies being backed partially by Bitcoin or central banks adding it to their balance sheets could easily cause this to happen.


How much longer? Before squeeze up?Hi All
Evidently, PA is sideways for the last ~6 months
NO ACTION
However, this might be ending soon.
Such times, as long as it might take further, are excellent for accumulation.. just like buying any commodity at a "fixed price"
Long term hodlers will be rewarded one day.. IT IS A GIVEN.
SHORT term does NOT matter
What do you think?
Thnx
Jad


We are very close to the bottom.The FTX bankrupcy shocked everybody and with that being written down into history we are quite near or have already had the final capitulation.
Here I'd like to make the distinction between hitting the bottom and trend reversal, a trend reversal usually takes time to print a reversal pattern of some sort, it might be an Adam&Eve, or Ascending Triangle, or Rounding Bottom, with the exception of a very hard to catch 'V shaped' reversal.
In terms of timing I've put on the Fib Time Zone tool(Love tradingview!) and interestingly we are at 1.618 in which pretty much every previous bottom lands.
Please note that as for the time being we still haven't got into any trade, we are monitoring shorter time frames for an entry. (yes we are timing the market and we are good on it)
Just sharing this information to you guys and keep your precious money safe for the next bull run, Take care until next time!
###NOT FINANCIAL ADVICE###

AW Bitcoin Analysis - The Definitive Conclusion Chart...Please take a moment to imagine such a scenario in which these waves could play out.
It might have something to do with US Dollar strength and higher interest rates.
On a positive note, we all know what comes after Wave 2.
Would you rather use the waves to determine future price action or a lovely hopium chart full of rainbow ribbons and death crosses, I mean moving averages.
Of course, this is just a logical way of looking at a chart but logic flies out the window when you have your Lambo lenses on.
It may not go that low or it might go lower. No one can really know what the state of the world will be during that time.
Asset prices may have declined significantly priced in worthless FIAT.
Social unrest, war, famine, pandemics and supply chain failure.
We don't really know but we do know that what goes up must come down, even if that means it will go up harder later.
Please see all related wave analysis videos linked below.
Remember to use Disciplined Money Management Principles to ensure longevity as a trader.
If you don't know the long term pattern shouldn't you be doing your research instead of just following the crowd?
Just remember: I am not a financial adviser; I suggest using this only as a guide. Always do your own research.


We made it famWe hit .113 fib at $3200 from the top as usual. First fib was 34.618 at $1200 followed by 21.618 at $19k. Next fib is 13.168 at $222k. It can hit again $3200 but based on MA 200 weekly historical support I would say that we're basically done with the bear market. Don't sell. Don't trade. just buy and hold. $222k will come in 4.5-5.5 years. 35x to 60x return depending on where you enter. Cheers!

2010-2023 Elliott Wave: BitcoinBitcoin is a decentralized digital currency, without a central bank or single administrator, that can be sent from user to user on the peer-to-peer bitcoin network without the need for intermediaries. Transactions are verified by network nodes through cryptography and recorded in a public distributed ledger called a blockchain. The cryptocurrency was invented in 2008 by an unknown person or group of people using the name Satoshi Nakamoto. The currency began use in 2009 when its implementation was released as open-source software.

BTC (BNC) 1D - Are we seeing lower lows before Trendreversal?Bitcoin is rallying since couple of days and making all Bulls extremely happy, yet, we need to pay attention of possible downtrends or invalided patterns for a bullish scenario.
The falling wedge (purple) is playing out so far. Adding FIBA from the local high (5. NOV - Start FTX Saga) we see that level of -0.618 are reasonable.
For now we are looking at Fiba level 0.5 that coincides with the falling wedge and a Reversal Point (blue). Eventually we get higher to Fiba 0.618 as potential Bull trap and get all the way down before we rally.
At the level of 18,700$ for Bitcoin is a major liquidation level waiting to dumb the price. Another liquidation levels are at 15,500$ and 13,800$
Thanks for reading, commenting and sharing.
