Investment Opportunity SLB (Short)SLB is Bearish in 6months timeframe, the price is back on supply which initiated this bearish trend, we can see now that the price ic currently accumulating orders, a wyckoff is in place.
I'm expecting now the price to reach downside liquidity at 39.5 $ and potentially continue until 16$.
Upside risk 15%
Downside max profit 67%
SLBG34 trade ideas

SLB Set To Acquire ChampionX, Return $7 Bln To ShareholdersNYSE:SLB , formerly known as Schlumberger, has announced plans to acquire ChampionX ( NASDAQ:CHX ), a leading provider of chemistry solutions and drilling technology. The acquisition, coupled with a substantial $7 billion shareholder return plan, signals SLB's commitment to driving growth and delivering value to its investors in the years to come.
The all-stock transaction, unanimously approved by ChampionX's board of directors, will see ChampionX shareholders receiving 0.735 shares of NYSE:SLB common stock for each NASDAQ:CHX share they own. Upon completion of the deal, ChampionX shareholders will own approximately 9% of SLB's outstanding common stock, underscoring the scale and significance of the acquisition.
Houston-based SLB anticipates significant synergies from the merger, with annual pretax benefits of approximately $400 million expected in the first three years post-closing. These benefits will be derived from a combination of revenue growth and cost savings, further enhancing SLB's competitive position in the market.
The transaction is subject to regulatory approval and the green light from ChampionX shareholders, with NYSE:SLB aiming to finalize the deal before the end of 2024. Additionally, SLB has announced plans to return $7 billion to shareholders over the next two years, reaffirming its commitment to maximizing shareholder value and enhancing returns.
Goldman Sachs has expressed confidence in SLB's prospects, adding the stock to its Conviction List and maintaining a buy rating. This move reflects the firm's bullish outlook on SLB's growth trajectory and strategic initiatives.
The acquisition of ChampionX follows SLB's recent agreement to purchase a majority stake in Aker Carbon Capture, further expanding its portfolio and strengthening its position in the energy sector. With ACC set to own 20% of the combined entity, SLB's acquisition strategy is aimed at bolstering its capabilities and diversifying its offerings to meet the evolving needs of the industry.
On the stock front, NYSE:SLB saw a slight easing of 1% following the announcement, while ChampionX shares surged by 10.4%. Both companies have been consolidating since early 2023, with SLB's stock showing a promising trajectory towards a potential breakout point. With West Texas Intermediate oil prices trading above $85 for the first time since October, the industry outlook appears favorable, providing a tailwind for SLB's growth prospects.
As NYSE:SLB embarks on this transformative journey, the acquisition of ChampionX and the robust shareholder return plan underscore the company's vision and commitment to driving sustainable value creation. With a solid foundation and a strategic focus on innovation and efficiency, SLB is well-positioned to capitalize on emerging opportunities and deliver long-term value for its shareholders.


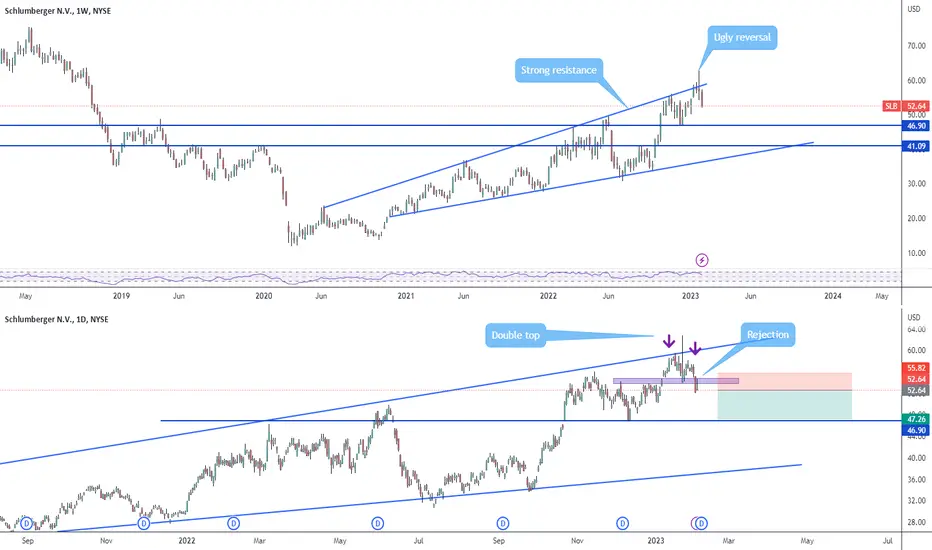
$SLB : outperforming stock in strong sectorSLB consolidating inside an ascending triangle with possible breakout to ATH (all time high) levels above $56
Shrinking Volumes with price in consolidation showing base formation for breakout to higher levels
SLB is an outperforming stock in a strong sector $SPN

Shlumberger - SLB LongA failed dragon turned into a beautiful falling 3 drives pattern with bullish divergence all happening at a long respected demand line.
Easy trade to size up risk on, again never know what will happen.
Unfortunately this is one again that we took and posted in the community two weeks ago. It would be equitable now if you played it to the high or third target.

Monitoring $SLB to enterValuation seems very attractive
Earnings are expected to grow moving forward
However the share price trend looks bearish
Will have to monitor if it will break the support level
or it's undergoing a turnaround from the low.
The share price is also somewhat moving in line with the WTI oil price.

Schlumberger's Stellar Performance in 2023: Key Highlights
Schlumberger Limited (NYSE: NYSE:SLB ), a world-renowned oilfield services provider, has concluded a remarkable year, surpassing analysts' estimates for quarterly profit and showcasing robust growth in its international business. Despite geopolitical uncertainties and regional tensions, NYSE:SLB 's CEO, Olivier Le Peuch, remains optimistic about the company's future prospects. Let's delve into the key highlights of SLB's impressive fourth-quarter and full-year performance.
Global Expansion and International Growth:
Schlumberger's success in recent years can be attributed to the rising demand for its oilfield services and equipment, particularly in international markets. The company has experienced substantial growth in regions such as the Middle East, Angola, and Central and East Africa, driven by increased oil exploration and production activities.
In the face of geopolitical challenges, including the conflict in Gaza and attacks on ships in the Red Sea, NYSE:SLB has demonstrated resilience. The company reassures investors that it does not anticipate a significant impact on its Middle East business, emphasizing its commitment to sustained growth in the region.
Record Investment Levels and Geographic Opportunities:
NYSE:SLB anticipates record investment levels in the Middle East extending beyond 2025, underlining the company's strategic focus on this vital market. Additionally, opportunities for continued offshore activity are identified in key regions such as Brazil, West Africa, the Eastern Mediterranean, the Middle East, and Southeast Asia. Le Peuch's optimistic outlook positions Schlumberger as a global leader with a proactive approach to capitalizing on emerging opportunities.
Financial Highlights:
Schlumberger reported robust financials for the fourth quarter and the full year of 2023. Quarterly revenue increased by 8% sequentially and 14% year on year, reaching $8.99 billion. Full-year revenue showed a remarkable 18% year-on-year growth, totaling $33.14 billion. Notably, the acquisition of a subsea equipment business contributed significantly to the quarter's sequential revenue gain.
The company's CEO highlighted the impressive growth in earnings per share (EPS), excluding charges and credits, which increased by 10% sequentially and 21% year on year, reaching $0.86 in the fourth quarter. Adjusted EBITDA margins also achieved another cycle high, showcasing the company's operational efficiency.
Strategic Moves and Shareholder Returns:
In a move that demonstrates confidence in its financial position, Schlumberger announced a 10% increase in its quarterly cash dividend, now standing at $0.275 per share. The company also plans to boost share repurchases in 2024, signaling its commitment to delivering value to shareholders.
Conclusion:
Schlumberger's exceptional performance in 2023 solidifies its position as a resilient and forward-thinking player in the oilfield services sector. Despite challenges in the global landscape, the company's strategic initiatives, robust financial results, and optimistic outlook on key markets position it for continued success in the years to come.

Uptrend is in an early stage - Bullish signal is in NYSE:SLB is heading for an early bullish signal after the price action shows an early stage of potential upside. First, Ichimoku's conversion and baseline are performing a crossover. Next the strong bullish rebound on 14th Dec marks the early interest of the bull.

Stocks pairs trading: VLO vs SLBIn the energy sector, a comparative analysis of financial metrics and market dynamics between Valero Energy Corporation (VLO) and Schlumberger Limited (SLB) reveals distinct investment perspectives. Examining their financial performance and market standings suggests a strategic approach to investing in these stocks.
Reasons to Consider VLO Over SLB:
Earnings Per Share (EPS): VLO's EPS of $29.33 is notably higher than SLB's $2.88. This indicates that VLO is currently more profitable and efficient in its operations compared to SLB.
Forward P/E Ratio: VLO's forward P/E ratio is 8.98, which is lower than SLB's 14.48. A lower forward P/E ratio may suggest that the stock is potentially undervalued relative to its future earnings potential.
Dividend Yield: VLO offers a dividend yield of 3.17%, compared to SLB's 1.84%. For income-focused investors, VLO's higher dividend yield is more attractive.
Year-to-Date Performance: VLO’s performance (1.35% YTD) is relatively stable compared to SLB's (-2.38% YTD), suggesting a more consistent investment opportunity, especially considering VLO's higher EPS and dividend yield.
Decision:
Buy 1 VLO: Given its higher profitability, attractive dividend yield, lower forward P/E ratio, and stable year-to-date performance, VLO presents a compelling investment choice, especially for those seeking both growth and income.
Sell 3 SLB: While SLB shows strengths in profit margin and a respectable forward P/E ratio, its lower EPS, dividend yield, and slightly negative year-to-date performance suggest it may not offer the same level of overall value or potential as VLO in the current market context.

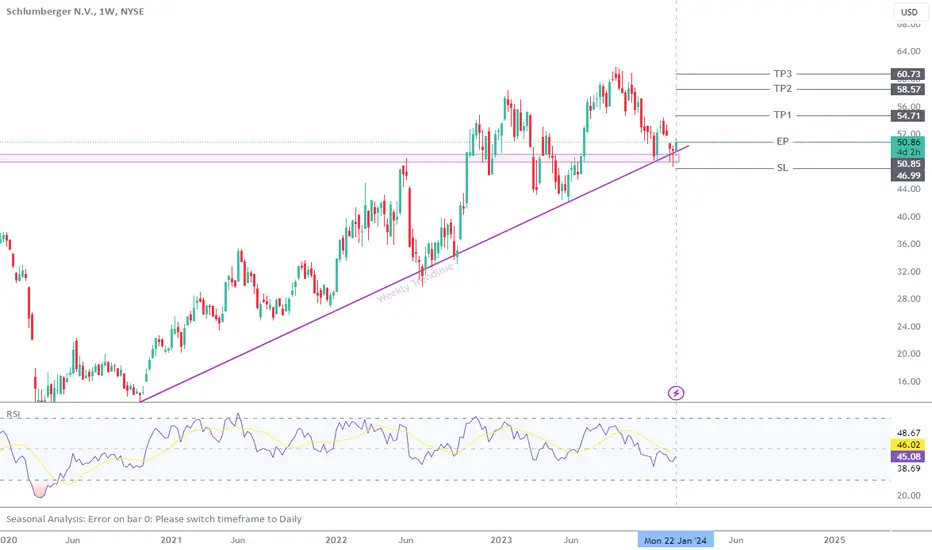
Is Schlumberger ready to change the trend?Schlumberger looks good from a risk reward basis as long as it holds $48.57 on a closing basis. If the stock closes below $48.57 the next support will be around $42.
On a bullish side targets are highlighted.
Educational purpose only not a recommendation. Please do u DD

SLB Schlumberger Limited Options Ahead of EarningsAnalyzing the options chain and the chart patterns of SLB Schlumberger Limited prior to the earnings report this week,
I would consider purchasing the 61usd strike price Calls with
an expiration date of 2023-11-3,
for a premium of approximately $1.69.
If these options prove to be profitable prior to the earnings release, I would sell at least half of them.
Looking forward to read your opinion about it.


Rising WedgeRising Wedges are Bearish but are not valid until the bottom line is clearly broken.
A level of support will usually catch price if it/when breaks down.
Both lines slope up and narrow at the apex.
Sometimes price will break up from a Rising Wedge, but eventually price will break the bottom line. It can be a long time in some cases.
A Rising wedge represents a supply overload within the wedge.
No recommendation

Is Schlumberger Done Slumbering?Schlumberger surged early last month. Now, after a period of consolidation, it may be ready to continue upward.
The first pattern on today’s chart is the high-volume rally July 7-11. (This was part of a broad move across the energy sector as crude oil came off its lows.) SLB broke its early-March peak around $56, followed by successful retests under that level on July 21 and August 23. Old resistance could have morphed into new support.
Second, notice how the more recent probe resulted in a bullish outside day. That may suggest the presence of lurking buyers.
Third, the 50-day simple moving average (SMA) recently had a “golden cross” above the 200-day SMA. The shorter-term 8-day exponential moving average (EMA) is also above the 21-day EMA.
Finally, the oil-service stock ended last week bouncing slightly above $56. It then proceeded to challenge a short-term falling trendline that’s taken shape since July 11. Is a breakout starting?
TradeStation has, for decades, advanced the trading industry, providing access to stocks, options, futures and cryptocurrencies. See our Overview for more.
Important Information
TradeStation Securities, Inc., TradeStation Crypto, Inc., and TradeStation Technologies, Inc. are each wholly owned subsidiaries of TradeStation Group, Inc., all operating, and providing products and services, under the TradeStation brand and trademark. TradeStation Crypto, Inc. offers to self-directed investors and traders cryptocurrency brokerage services. It is neither licensed with the SEC or the CFTC nor is it a Member of NFA. When applying for, or purchasing, accounts, subscriptions, products, and services, it is important that you know which company you will be dealing with. Please click here for further important information explaining what this means.
This content is for informational and educational purposes only. This is not a recommendation regarding any investment or investment strategy. Any opinions expressed herein are those of the author and do not represent the views or opinions of TradeStation or any of its affiliates.
Investing involves risks. Past performance, whether actual or indicated by historical tests of strategies, is no guarantee of future performance or success. There is a possibility that you may sustain a loss equal to or greater than your entire investment regardless of which asset class you trade (equities, options, futures, or digital assets); therefore, you should not invest or risk money that you cannot afford to lose. Before trading any asset class, first read the relevant risk disclosure statements on the Important Documents page, found here: www.tradestation.com .

SLB: Ascending Triangle, Not Confirmed (48.31%)(16/1000)(16/1000)
Ascending Triangle for SLB.
NOT Confirmed. Possible 48,31% gains.
Pros:
1- Bullish Ascending triangle
2- Descending volume during formation
3- PPS above 50MA and 200MA
4- R/R ratio above 5
5- 250RSI above 50 and ascending
6- 50MA above 200MA
7- 50MA and 200MA ascending.
8- RS above 0 and ascending
Cons:
1- ATR flat, less volatile
2- Pattern not confirmed
3- No break out yet
Target price is 88.14$.
Again, stay humble, have fun, make money!
MAAX!


SLB is breaking out of a head and shoulders patternIn this chart I point to main chart pattern in the SLB prices at this moment, that is the head and shoulders. Not only that, but the prices are doing a breakout of this pattern, that I indicate step-by-step at the purple text in the chart.
I am also trying to take some advantage of this movement, and so I bought a very short term put option to try catch some profit from an eventual falling in prices. The put information is in the gray text in the chart.