TSLA: Buy ideaHigh probability of an uptrend on TSLA as you can see on the chart. This trend will be confirmed when the resistance line is forcefully broken by buyers.
TSLA34 trade ideas

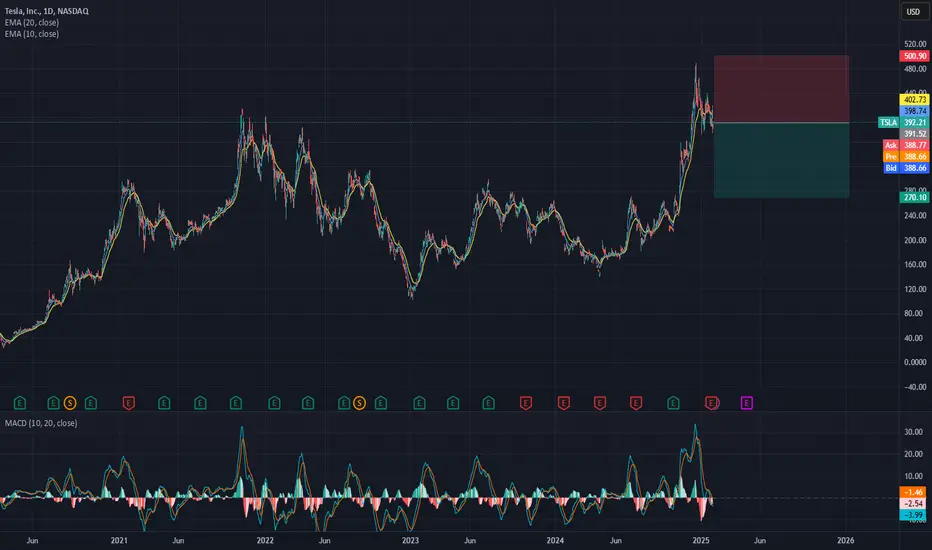
Tesla - Another +100% After This Breakout!Tesla ( NASDAQ:TSLA ) can still double from here:
Click chart above to see the detailed analysis👆🏻
With Elon Musk actually becoming the richest person on this planet, Tesla is simultaneously attempting another all time high breakout. All the recent bullish momentum could further fuel this rally, leading to new all time highs and another 2x in Tesla's market cap.
Levels to watch: $450, $900
Keep your long term vision,
Philip (BasicTrading)

TSLA, Long, 15m✅TSLA is oversold and is showing a strong buy signal, with a bullish RSI divergence confirming a potential reversal. The price is expected to move higher in the short term.
LONG 🚀
✅ Like and subscribe to never miss a new analysis! ✅

[02/03] TSLA GEX Outlook for February expiration📌 Key Levels & GEX Insights
Gamma Flip Zone: ~400 (until Febr expiration)
Tight Transition Zone, Wide Clear Movement Range
Above 420 Call Resistance : Every strike has positive Net GEX, meaning a return to this range would likely support further balanced upside or sideways movement.
Below 375 : The next PUT support is at 350, so a break below this level could open the door for a deeper drop.
There are 3 weeks until expiration. IV and IVR remain high even after earnings.
Despite today’s selloff, the high call pricing skew is still attractive if we want to collect credit.
In this case, a call butterfly or broken-wing call butterfly could be worth considering—but strictly based on GEX levels.
PS: FINAL GEX ZONE COLORING SHEET

TSLA - Optimistic Reversal ZoneNASDAQ:TSLA still in correction wave.
A potential price reversal zone (PRZ) is around 320.
If we can have it, it might be okay to keep it along this year.

$TSLA potential bottom hereI see a 78.6% retracement of the previous move,
And potentially a wyckoff spring.
If we get a strong bounce here, Uptrend should continue.

TSLA 367.5 PUT 2/7/25 (Win)Saw TSLA broke out to the downside of a Daily descending triangle, and broke below the daily/weekly trend line leading me to a slightly bearish bias on top of the tariff news from Trump. 1HR timeframe showed a mini downtrend and what appeared to be a head & shoulder pattern. Dropped down to the 15 minute timeframe, and saw price broke below the ORB low, made a 15min head & shoulder and also formed a bearish flag pattern, which lead to me entering the trade. Multiple confluences for the win.

Short tesla Weakness... plummeting EU sales... Elons Dream of autonomous driving and optimus sales are not right behind the corner...


W Formation on Tesla for the LONG run 110% upside to comeTesla is showing all signs of upside this year.
They are putting their money in the right places.
Advancements in Autonomous Vehicles: Tesla plans to launch self-driving robotaxi services in Austin by mid-2025, signaling significant progress in autonomous technology.
INVESTORS.COM
Innovations in Robotics: The company is ramping up production of its Optimus humanoid robots, aiming to produce several thousand by the end of 2025, showcasing its commitment to cutting-edge robotics.
Strategic Political Alliances: CEO Elon Musk's close relationship with President Donald Trump has led investors to anticipate favorable regulatory changes and reduced government oversight, potentially benefiting Tesla's operations.
So innovation, robotics and politics. Either we will see huge growth this year, or we are in for a BIG surprise. However, because this is a weekly chart it can take two years for this to play out realistically.
W Formation
Price>20 and 200
Current falling Wedge
Target $684.41

Tesla High Risk of $255Tesla is Stuck under $430 ATH resistance and at high risk of falling back to $255 support.
Tesla is no longer growing and Musk is polarizing and alienating their mostly progressive leaning customer base. This stock simply makes zero sense for a 200 pe ratio.

Why Tesla Stock Could FallHi traders this is why tesla could fall in the coming days.
- Musk’s political alignment with Trump may alienate environmentally conscious buyers and complicate international expansion, especially in markets like the EU where Chinese competitors face high tariffs.
- Tesla's 2024 annual deliveries fell for the first time in its history (1.79 million EVs, down 1.1% from 2023), missing Wall Street expectations and raising doubts about its ability to achieve Musk’s 20–30% growth target for 2025.
- Tesla has repeatedly slashed prices in China to maintain market share, but this strategy is eroding profit margins
- Tesla’s P/E ratio of 200 far exceeds peers like Apple or Microsoft
- Tesla’s growth narrative hinges on Full Self-Driving (FSD) and robotaxis, but regulatory approval delays and technical challenges persist, these initiatives are unlikely to generate significant revenue before 2026
I am looking for shorts around 409.74, Targeting 291.89 with stop loss at 468.74

Tesla: The New Gold in the World of Investing?Tesla is showing incredible growth at the level of Bitcoin and reminds me a lot of the structure of the leading cryptocurrency! Given the potential of Ilon Musk's company and his imminent tenure, we should not rule out “golden” times for his companies. Tesla has a great track record of building robots, developing super capacitors for its electric cars, and developing its own AI and its application in autopilot. Tesla looks like a great investment option right now, both long term and for a couple years.
Horban Brothers.

TSLA potential hold around 375-378Probably see a liquidity sweep below 375 and rally on TSLA.
360 is a strong support below as well - from previous base break level from Nov 2024.

TSLA: Technical Analysis (TA) for Feb. 7Timeframe: 1-Hour Chart
Market Overview
* Current Price: $370.88
* Key Resistance Levels:
* $380: Immediate resistance. A breakout above this level aligns with a potential gamma squeeze.
* $400: Higher resistance and critical level for bullish continuation.
* Key Support Levels:
* $363: Closest support, aligned with the highest negative GEX level.
* $350: Stronger support and psychological level with higher PUT concentration.
Trend Analysis
* TSLA is moving within a descending triangle. A breakout above $380 could signal a bullish reversal.
* However, price action remains constrained, suggesting cautious entry until direction is confirmed.
Momentum Indicators
* MACD: Bearish momentum is easing, but there is no clear bullish crossover yet.
* Stochastic RSI: Overbought in short-term, indicating the potential for short-term consolidation before further moves.
Gamma Exposure (GEX) for Option Trading
GEX Overview:
* Call Resistance:
* $380: Strong resistance aligned with 92.29% CALL wall concentration.
* Put Support:
* $363: High negative GEX level, suggesting robust support.
* Sentiment: GEX indicates a neutral-to-bearish sentiment due to concentrated PUT walls below the current price.
Trading Suggestion
Options Trade Scenarios:
1. Bullish Setup:
* Entry: Buy 7 DTE Call Options if the price breaks above $380 with strong volume.
* Target: $400.
* Stop Loss: Below $374.
2. Bearish Setup:
* Entry: Buy 7 DTE Put Options if the price drops below $363.
* Target: $350.
* Stop Loss: Above $368.
Critical Observations
* At market open, price movements may shift due to increased volume and volatility. Ensure to check real-time GEX updates to validate your setups.
Disclaimer
This analysis is for educational purposes only and does not constitute financial advice. Always perform your due diligence and manage risks accordingly.

Looking for another bounce...Head and shoulders pattern has completed, now I'm looking for another bounce at or near $422, which should cause the Bollinger to squeeze before the next big move.

TSLA: RL and SL converge: Buy ideaOn TSLA, we can see on the graph that the resistance line and the support line converge. This means that we should expect a high probability of the market going higher.

TSLA Next Leg Up Tesla looks primed for a strong move after consolidating. The stock has been trading in a tight range, building up momentum, and now appears ready to break out soon. With higher lows forming and volume showing signs of accumulation, a bullish move could be imminent. If TSLA pushes past resistance with strong buying pressure, we could see a significant rally in the coming sessions. Watching for confirmation and a clean breakout—this could be the start of the next leg up.

TSLA Analysis chartHello'
TSLA has been forming a triangle pattern. I've drawn a trend line connecting the highs, stretching from the top to the support level. Now, I'm waiting for a breakout, which may potentially lead to a bullish movement.
Target.
437.21
480.00
It's my take what you think about "TSLA" write in comment section. Thanks.

$TSLA Short - Weekly TFAbout to pose the 50-Day HMA. Looks to be rolling over on multiple timeframes. Fundamentally, while nothing seems out of sorts—other than car batteries setting on fire and locking passengers inside—I think some political circumstances will change things imho.

TSLA to circa $500 Given the logical progression of infrastructure development, I anticipate an announcement from the current administration regarding the initiation of this project in the near future.
The project's appeal lies in its incremental nature and relative ease of implementation. It can be initiated on a limited scale and expanded gradually, making it both cost-effective and manageable compared to other large-scale infrastructure endeavors.
My analysis suggests that this infrastructure initiative has the potential to be the most GDP-generative project currently conceivable. Its economic impact, combined with Tesla's strong position in the EV and autonomous driving sectors, could serve as a powerful catalyst for the company's stock performance, potentially pushing it beyond the projected $499-$500 range.
While stock predictions should always be approached with caution, the convergence of these factors - the observed double bottom pattern, the potential infrastructure project, and Tesla's market position - presents a compelling case for potential upward movement in Tesla's stock price.
This assessment is based on current market conditions and available information, and is subject to change as new data emerges.
Tesla Stock Analysis and Infrastructure Prediction Upon careful analysis of Tesla's stock performance, I have formulated a hypothesis regarding its future trajectory. Technical analysis indicates the formation of a double bottom pattern, with the bottoms observed at $387 and the peak between the two bottoms at $439. This pattern traditionally signals a potential price movement that could reach $499 to $500 or higher, representing a significant upward trend for Tesla's stock.
A key catalyst I've identified that could substantially impact Tesla's valuation is the prospective implementation of Full Self-Driving (FSD) Lanes for logistics EV transports. While this is based on my own analysis rather than insider information, calculations suggest this infrastructure project could be the most economically viable and impactful initiative in the near term.
The projected benefits of this infrastructure project include:Significant reduction in transport costs
Mitigation of inflationary pressures
Creation of substantial employment opportunities
Generation of considerable tax revenue.

TSLA: Buy ideaBuy idea on TSLA as you can see on the chart if only if we have the breakout with force the vwap and the resistance line by the buyers.

TESLA is overvalued and here is why - waiting for 270Tesla is overvalued, especially when compared to traditional metrics like P/E ratio. We have P/E 190 atm. If we compare Tesla to other EV companies, Tesla’s valuation might appear inflated. For example, companies like Rivian, Lucid, and NIO have been hyped similarly, but most haven’t shown the same level of growth and revenue.
Investors are betting on Tesla’s dominance in electric vehicles, energy, and other sectors, which drives the high valuation. Tesla's stock is also closely tied to Elon Musk’s reputation, decisions, and Twitter presence.
Tesla has become more profitable in recent years, but many argue that it’s still a growth company where profits aren't the main focus. The question is whether the current market cap is justified based on actual cash flow and profitability - of course NO.
Tesla was created as a startup and truly revolutionized the auto industry, but its stock is now worth several hundred times more than it is as a technology-driven car manufacturer. Future expectations have always driven the stock market, and this phenomenon will continue to accompany us. However, I believe that in terms of future expectations, Tesla, as an automaker, has long since exhausted its potential, and its competitors have long been replicating Tesla's "miracle," but in much more efficient ways.
A vivid example of this is the recent story of ChatGPT and DeepSeek. I am confident that sooner or later, Tesla will also become a "victim" of this.
On the other hand, Elon Musk’s reputation, political involvement, and trade wars—all of these are potential bombs placed under Tesla.