Nightly $SPY / $SPX Scenarios for July 8, 2025🔮 Nightly AMEX:SPY / SP:SPX Scenarios for July 8, 2025 🔮
🌍 Market-Moving News 🌍
📉 U.S. Stocks Slip on New Tariff Threats
President Trump announced plans to impose 25% tariffs on imports from Japan, South Korea, Malaysia, Kazakhstan, South Africa, Laos, and Myanmar starting August 1, reigniting trade jitters. The Dow fell ~0.9%, the S&P 500 dropped ~0.8%, and the Nasdaq slid ~0.9% on the news, while bond futures rallied and the dollar strengthened
⚖️ Tariff Pause Deadline Looms
Markets are focused on the July 9 deadline for the current tariff pause, which now hinges on imminent trade negotiations. Investors are balancing the risk of reimposition against progress with agreements involving the U.K., Vietnam, and Canada
💵 Consumer Credit Moderates
June’s consumer credit increase slowed to $10.60 billion vs. April’s $17.87 billion—still strong, but a cooling sign in household borrowing patterns. This tempered the dollar’s rise amid mixed signals on consumer resilience.
🛢️ Oil Drops on Rising OPEC+ Supply
Oil prices fell, with Brent dipping to ~$68.00/barrel and WTI to ~$65.30, after confirmation of OPEC+’s August supply hike—adding to bearish cues for energy stocks .
📊 Key Data Releases & Events 📊
📅 Tuesday, July 8:
3:00 PM ET – Consumer Credit (June)
Moderation in borrowing signals possible easing in consumer-driven growth.
4:30 PM ET – API Weekly Crude Inventories
A key indicator for energy markets; lower inventories lift oil prices, while builds push them down.
Throughout the Day – Tariff Pause Deadline
Market stability hinges on whether trade agreements materialize before the break expires.
⚠️ Disclaimer:
This information is for educational and informational purposes only and should not be construed as financial advice. Always consult a licensed financial advisor before making investment decisions.
📌 #trading #stockmarket #economy #tariffs #consumercredit #oil #technicalanalysis
SPDR S&P500 ETF TRUST S&P 500 ETF USD DIS
11,560.000MXND
−50.000−0.43%
At close at Jul 7, 19:54 GMT
MXN
No trades
SPY trade ideas

Weekly $SPY / $SPX Scenarios for July 7–11, 2025🔮 Weekly AMEX:SPY / SP:SPX Scenarios for July 7–11, 2025 🔮
🌍 Market‑Moving News 🌍
📈 From Panic to "Goldilocks" Rally
The S&P 500 and Nasdaq hit fresh record highs, surging ~20% from April lows. Markets rallied on a combination of easing Middle East tensions, the 90‑day tariff pause, a new fiscal bill in Washington, and strong June jobs data. Still, strategists caution that optimism may be ahead of fundamentals, especially if trade volatility returns
💱 Dollar Weakness & Bond Market Watch
The U.S. dollar remains near 3.5‑year lows amid rate‑cut speculation and trade progress. Treasury yields are volatile this week, impacted by concerns over escalating debt issuance, upcoming tariff deadlines (July 9), and the Federal Reserve’s stance .
🏢 Tech Leadership Shifts
With the “Magnificent Seven” tech stocks near heights, growth is spreading: cyclical sectors, small‑caps, and industrials are gaining momentum. AI remains the primary engine, but resilience across a broader stock base is signaling a potentially sustainable rally
⚠️ Tariff Truce Deadline Looms (July 9)
The April tariff pause expires mid‑week. U.S. plans to extend exemptions via trade talks with partners like UK, Vietnam, and Canada—yet any delay or failure may shock markets. Watch for headlines that may trigger spillover effects .
📊 Key Data Releases & Events 📊
📅 Monday, July 7:
Independence Day markets resume. Light trading expected ahead of data and tariff deadline.
📅 Tuesday, July 8:
10:00 AM ET – Consumer Credit (June)
Gauges borrowing trends—an indicator of household health in a low‑rate environment.
📅 Wednesday, July 9:
EIA Crude Oil Inventories & MBA Mortgage Apps & Wholesale Inventories
Key mid‑week data points; oil builds may pressure energy stocks.
Tariff Pause Deadline – Expect market volatility on news of extension or reimposition.
📅 Thursday, July 10:
8:30 AM ET – Initial & Continuing Jobless Claims
10:00 AM ET – Natural Gas Inventories
Markets focus on labor health and energy trends.
📅 Friday, July 11:
10:00 AM ET – Treasury Budget Statement
Details on government borrowing and fiscal outlook—markets sensitive to deficit risks.
⚠️ Disclaimer:
These insights are for educational purposes only—not financial advice. Consult a licensed advisor before making investing decisions.
📌 #trading #stockmarket #economy #news #tariffs #Fed #AI #technicalanalysis
Opportunity Beneath the Fear: SPY's Reversal SetupIn the Shadow of Headlines: SPY’s Drop Could Be 2025’s Big Opportunity
As markets react sharply to renewed tariff fears and Trump-related headlines, SPY continues its descent. Panic is setting in—but behind the noise, a strategic opportunity may be quietly forming.
While many rush to exit, others are beginning to position for the bounce. A well-structured entry strategy could be key to turning uncertainty into gains.
Entry Zone (Staggered):
🔹 543: First watch level—look for signs of slowing momentum.
🔹 515: Deeper entry point as the selloff extends.
🔹 <500 (TBD): Stay flexible—if panic accelerates, this could mark a generational setup.
Profit Targets:
✅ 570: Initial rebound target.
✅ 590: Mid-range level if recovery builds.
✅ 610+: Full recovery potential—rewarding those with patience and vision.
Remember: Headlines fade, but price action and preparation stay. This selloff may continue—but it might also be laying the foundation for 2025’s most powerful move. The key? Enter with discipline, protect your capital, and let the market come to you.
⚠️ Disclaimer: This content is for educational purposes only and does not constitute financial advice. Trading carries significant risk. Always conduct your own research and use proper risk management.

SPY: Bearish Continuation & Short Trade
SPY
- Classic bearish pattern
- Our team expects retracement
SUGGESTED TRADE:
Swing Trade
Sell SPY
Entry - 625.36
Stop - 633.00
Take - 611.27
Our Risk - 1%
Start protection of your profits from lower levels
Disclosure: I am part of Trade Nation's Influencer program and receive a monthly fee for using their TradingView charts in my analysis.
❤️ Please, support our work with like & comment! ❤️


SPY Breaks Out of Gamma Box! Will It a Trend Day or Fade Setup?SPY Breaks Out of Gamma Box! Will IT Trigger a Trend Day or Fade Setup? 🚀📉
🔍 Chart Overview
* Timeframes: 1H (GEX + key zones), 15M (Price action + SMC).
* Price: $601.65 at close.
* SPY broke above 600, a key GEX resistance and call wall area, and is pushing into a zone with less options resistance.
📊 GEX + Options Sentiment
* 601–602 Zone: Highest positive NET GEX, aligned with CALL wall and resistance—where market makers may start to hedge against upside.
* 604–606: Next upside liquidity zone; low GEX, meaning little dealer resistance = gamma vacuum potential.
* IVR: 21.2 (elevated slightly).
* Put Positioning: 78.2% heavy skew—market still defensively positioned.
* GEX Shift: Bullish; breakout above 599–600 flips structure toward 604 as target.
📐 Smart Money Concepts (15M Chart)
* CHoCH → BOS Confirmed: Trend structure flipped bullish today.
* SPY rallied off demand at 591.90 (old support/OB) with increasing volume.
* Currently tapping into minor supply zone (purple box) at 601.5–602.
📈 Key Technical Levels
* Support:
* 599.00 (GEX flip zone)
* 596.41 (FVG support)
* 594.28 (OB + FVG confluence)
* Resistance:
* 602.00 (GEX wall + supply)
* 604.85 (GEX extension zone)
📌 Scenarios
🟢 Bullish Play (Momentum Breakout)
* Entry: Above 602.20 (confirm breakout of supply)
* Targets: 604.50 → 606.00
* Stop: Below 600.40
* Confluence: Gamma vacuum + weak resistance = ideal for calls if IV remains controlled.
🔴 Bearish Play (Fade from GEX Wall)
* Entry: Rejects 602 with wicks + high volume reversal
* Targets: 599.50 → 597.00 → 594.50
* Stop: Above 602.50
* Confluence: Heavy puts suggest rally could be faded unless institutions step in.
💡 Game Plan
* Watch 602 rejection or acceptance—this will likely decide the rest of the week's direction.
* If accepted, it's likely a gamma squeeze to 604–606.
* If rejected, SPY may dip back to 599–597 to retest bullish structure.
🎯 Options Strategy
* Bullish: Weekly 602C or 604C if breakout confirmed.
* Bearish: 600P for fade/rejection plays. Higher risk due to squeeze potential—tight stops.
🧠 Final Thoughts
SPY is at a pivotal level. The breakout from 599 suggests bulls in control, but we're now at Gamma resistance. Keep tight risk if playing calls above 602. The upside is open—but only if dealers lose control.
Disclaimer: This analysis is for educational purposes only and does not constitute financial advice. Always do your own research and manage your risk before trading.

Opening (IRA): SPY July 18th 495 Short Put... for a 5.13 credit.
Comments: Targeting the <16 delta strike paying around 1% of the strike price in credit.
Max Profit: 5.13
ROC at Max as a Function of Strike Price: 1.04%
Will generally look to roll up if the short put is in profit at 45 DTE or greater, add at intervals if I can get in at strikes better than what I currently have on at the June 513's and July 495's, and/or consider a "window dressing" roll (i.e., a roll down to a strike that is paying about the same in credit) to milk the last drops out of the position.


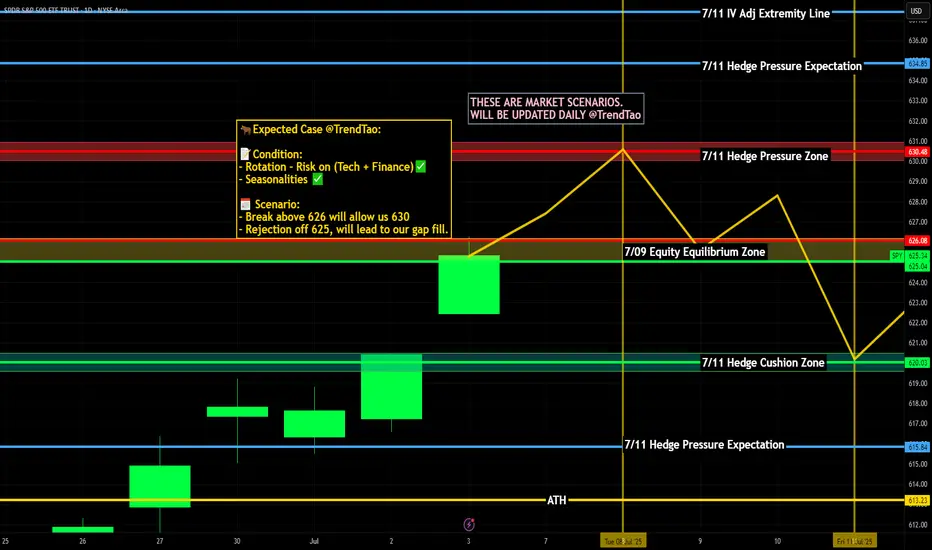
SPY 4HSResistance: 630 – Strong supply zone, potential profit-taking area.
Support Zone: Around 617 – Recently tested, holding as short-term support.
Gap: 615.03 → If SPY loses 617, watch for a retracement to fill the gap toward 615.
Major 4H Support: 610.17 – Institutional block. Losing this level would break the short-term bullish structure.

Long Trade Idea: SPY (S&P 500 ETF)!🧠
📅 Timeframe: 30-Minute
📈 Type: Long Position
📐 Setup: Tight consolidation breakout + bullish wedge pattern
📍 Trade Details:
Entry: $620.39 (breakout from rising wedge)
Stop Loss: ~$618.80 (below wedge support)
Target 1: $622.34 (minor resistance)
Target 2: $624.56 (major resistance zone)
🔎 Technical Breakdown:
Price formed a tight rising wedge, squeezing under resistance
Bullish breakout confirmed above consolidation
Strong uptrend continuation — higher highs + higher lows
SPY remains strong despite market hesitation
🎯 Risk/Reward Outlook:
Risk: ~$1.59
Reward: Up to ~$4.17
RR > 2.5:1 — ideal structure for breakout traders
💬 Caption (for Social/Chart Post):
“SPY breaks higher! 💥📈
Wedge breakout signals bullish momentum 🟢
Clean setup toward $624+ zone 🔓
Watch for continuation above $622.34!”
#SPY #LongTrade #BreakoutSetup #S&P500 #ProfittoPath #ETFTrading

SPY - TargetsWatching this wedge, Trump making headwinds with trade talks, striking a vietnam deal. Buyers still in control but hesitant, the "Big Beautiful Bill' being hashed out in the next couple of weeks. Could easily see a small pull back into the EMA's, Betting we see prices higher to the bullish target $700 if we can break above T/L with nice volume.

update on the markets 7/2/2025SPY continues to move up and I think a bit higher is likely still, although the bearish divergences are warning that another high may not hold. Gold may be bullish if it can push a bit higher. NG still looks bearish overall. USOIL also looks bearish. BTC is trying to breakout, but might not be able to just yet.


Nightly $SPY / $SPX Scenarios for July 2, 2025🔮 Nightly AMEX:SPY / SP:SPX Scenarios for July 2, 2025 🔮
🌍 Market-Moving News 🌍
🏭 U.S. Manufacturing Remains Under Pressure
The ISM Manufacturing PMI for June rose slightly to 49.0 from 48.5 in May—still in contraction territory. Tariff-induced uncertainty and rising input costs continue to weigh on factory activity, with new orders still weak and employment contracting
📈 Global Factory Rebound Led by India & Europe
While U.S. factories struggle, India hit a 14-month high in its manufacturing PMI at 58.4, and euro‑zone factory orders stabilized at 49.5—the first sign of recovery in over three years. Asia-Europe divergence may shift global capital flows .
🏦 Powell Says Tariffs Are Delaying Rate Cuts
Fed Chair Powell warned at the ECB forum in Sintra that elevated inflation—driven in part by Trump-era tariffs—has postponed the timeline for U.S. rate cuts. The Fed’s dot-plot now indicates only two cuts for 2025, with markets adjusting accordingly
💵 Dollar Nears 3½-Year Lows
The U.S. dollar weakened further, trading near a three-and-a-half-year low amid soft PMI data, a dovish Fed tilt, and renewed optimism over U.S.–Canada trade talks
📊 Key Data Releases & Events 📊
📅 Wednesday, July 2:
(No major scheduled U.S. economic data)
Market focus shifts to upcoming Nonfarm Payrolls on July 3, Powell's remarks, and trade-talk headlines.
⚠️ Disclaimer:
This information is for educational and informational purposes only and should not be construed as financial advice. Always consult a licensed financial advisor before making investment decisions.
📌 #trading #stockmarket #economy #manufacturing #Fed #inflation #charting #technicalanalysis


SPY soars to new all time highsThere has been a lot of speculation about where SPY is going next. I believe a significant correction will happen in the near future. However, today SPY is creeping back into the strong uptrend it once had. Looking at chart patterns, SPY is building momentum once more and will be hitting another yet another all time high.

Nightly $SPY / $SPX Scenarios for June 26, 2025🔮 Nightly AMEX:SPY / SP:SPX Scenarios for June 26, 2025 🔮
🌍 Market-Moving News 🌍
💱 Dollar Mounts Decline on Fed Credibility Concerns
The U.S. dollar dropped to a 3½-year low against the euro after reports that President Trump is considering replacing Fed Chair Powell as early as September or October. The move fueled market concern about the Fed’s independence and prompted traders to raise the likelihood of a July rate cut to 25%, with nearly 64 bps of rate cuts priced in by year-end
📉 Markets Stay Cautious Ahead of Powell’s Testimony
Traders remain on edge as Fed Chair Powell’s Capitol Hill testimony continues. He reiterated caution, noting inflation risks tied to tariffs despite growing calls for easing, keeping interest-rate expectations in limbo .
📈 S&P 500 Nears All-Time Highs in Second-Biggest Bi‑Monthly Rally
The S&P 500 has notched its second-largest May–June rally on record (6.2% in May, further gains in June), bolstered by cooling inflation, easing Middle East tensions, and strong AI earnings momentum led by Nvidia. Bull-case scenarios could push the index to fresh highs
📊 Key Data Releases 📊
📅 Thursday, June 26:
(No major U.S. economic release—markets are focused on Powell’s remaining testimony and global risk dynamics.)
⚠️ Disclaimer:
This information is for educational and informational purposes only and should not be construed as financial advice. Always consult a licensed financial advisor before making investment decisions.
📌 #trading #stockmarket #economy #Fed #inflation #geopolitics #technicalanalysis

SPY/QQQ Plan Your Trade for 6-25 : Breakaway PatternToday's Breakaway pattern suggests the SPY/QQQ may attempt to move into another breakaway price move - very similar to yesterday's price move.
I will add that I believe the SPY cycle patterns have already moved through a breakaway phase with the ceasefire news early this week. I believe the gap and breakaway move yesterday may be the breakaway trend we are expecting today.
That would suggest the markets could pause and pullback a bit over the next few days.
Gold and Silver are trying to find a bottom after the brief selling that took place over the past few days. I really do believe Gold and Silver are poised to make a big move higher.
Bitcoin is on a terror to the upside. But be cautious of the downward cycle channel that may prompt a rollover in BTCUSD near the $107,500 level.
I spend a little time near the end of this video highlighting my work on the Tesla 3-6-9 price theory and going over a few examples for my new book on trading.
Enjoy the quick look at some of the more advanced techniques I'm working to unlock for all of you.
Get some.
#trading #research #investing #tradingalgos #tradingsignals #cycles #fibonacci #elliotwave #modelingsystems #stocks #bitcoin #btcusd #cryptos #spy #gold #nq #investing #trading #spytrading #spymarket #tradingmarket #stockmarket #silver

Nightly $SPY / $SPX Scenarios for June 25, 2025🔮 Nightly AMEX:SPY / SP:SPX Scenarios for June 25, 2025 🔮
🌍 Market-Moving News 🌍
💱 Dollar Slides on Middle East Ceasefire Optimism
A fragile ceasefire between Israel and Iran lifted risk sentiment across global markets. The U.S. dollar weakened, while the euro and British pound hovered near multi‑year highs
📈 Equities Near Record Highs
The S&P 500 and Nasdaq pushed toward all-time highs on June 25, supported by the Middle East truce and retreating energy prices. The S&P 500 rallied ~1.1%, with tech and discretionary sectors leading the charge
🛢 Oil & Treasuries Dip, Yield Cuts Anticipated
Oil plunged ~6% to ~$65/bbl as conflict fears eased. Softer prices plus weak consumer confidence spurred expectations of up to 60 bps in Fed rate cuts by December; Treasury yields pulled back accordingly
📉 Consumer Confidence Falls Again
The Conference Board’s index dropped to 93—the lowest level since May 2020—as concerns over tariffs and job availability weighed on households
📊 Key Data Releases 📊
📅 Wednesday, June 25:
(No major U.S. economic data scheduled)
Markets remain focused on geopolitical dynamics, Fed commentary, and next week’s PCE inflation release.
⚠️ Disclaimer:
This information is for educational and informational purposes only and should not be construed as financial advice. Always consult a licensed financial advisor before making investment decisions.
📌 #trading #stockmarket #economy #geopolitics #Fed #inflation #technicalanalysis
6/24/25 - $SPY - punchbowl musings. moar upside into YE.6/24/25 :: VROCKSTAR :: pondering $SPY/M2
I'll attempt to keep this punchy.
- Moar upside into YE, but with a few bumps along the road. We're probably due for a small garden variety pullback sooner vs. later. And it should be bought, without flinching. Index options are easiest and lowest risk way to play this trend, unless u like single names like me :)
- I look at the above chart SPY/M2 (so S&P divided by M2) a lot
- The last time it grabbed my interest was earlier this yr before the market did it's lil dip, now it's grabbing my interest again since we've played out a bottom and a recovery
- I wonder... is px action going to follow '98 (door 1) or the trapdoors of '08/09 (door 2)/ '20 (door 3)/ '22 (door 4).
- I suspect it's closer to '98 (and btw had this thesis before seeing the recovery in the last two months, so it's played out)
- While any event can cause the market to reset another 20-30% from here, the problem is "we don't have this event". Clearly war (at least an escalating one, not a multi-week headline-driven one - sad as any war is) won't do it. Also the Fed is just about telling Trump to suck the long one... and even that rates might go higher, but the mkt also is either ignoring this/ or frankly- might acknowledge it and doesn't care. Also we have a consumer recession on the horizon - this is no surprise to many of us. Market still doesn't really care. So what kind of event is it?
- Well in door 2 we had a pretty gnarly set of defaults in US housing. Will this happen again? Probably not in housing, there will be pockets, yes. But these sorts of things typically don't repeat, esp with the money printer locked and loaded.
- Door 3 was a "pandemic" (quotes intended) which freaked everyone out. Well played Klaus. But doubtful that card can be re-played without also seeing the money bazooka locked and loaded.
- Door 4 was rates FINALLY seeing liftoff after over a decade. But now they're pretty restrictive. Can they get more restrictive? Sure. But will they go up another 2...3...4...%? Unlikely. Direction ultimately is probably lower *eventually*, even if there's a bit more economic pain on mainstreet.
- So door 1 is somewhat unique. The market doesn't remember that timeframe well. And it feels like tech is back in that sweetspot. Mag 7 (just use QQQ on it's IWM- small cap pair) so QQQ/IWM or even SPY/IWM (both contain similar mag 7 weightings) shows no brakes. Hard to see why I'd rather pay 15 or 20x for a small cap with mid singles growth and no margin or moat vs. say NVDA at a slight premium. You get the point. So I think we're back there.
- Does that mean we get a garden variety pullbacks here/there along the way as headlines hit? Probably. I see a lot of crazy 0dte'ing all over the place. The cheapest and probably most profitable way to play that would simply be sticking to index options, tbh. But alas, that's not a 10 or 20x ;)
- Could a consumer recession in 2H keep stonks flat or only +5-10% higher capped until we can see "beyond"? Maybe. But remember, the big leaders (most Mag 7) are B2B and AI-driven. So you can paint an earnings story (lower costs b/c of tech) even if the top-lines are challenged. Again, let's see.
- Alas people have been DM'ing me "WHY ARE YOU SHORT?"
- Simply put, I have conviction in a very few number of things right now on the long side. I do think the market will tend to see higher highs, and there's not an obvious reason why that ends, just yet. And the market needs a reason to go down, not up.
- However, a lot of ETFs I've found to short are offering me ATM exposure for 5-10x leverage for very very little premium (low IV) relative to picking and banging my head causing brain damage to keep identifying the single names. Most of these ETFs own "the same company" which all trade correlation 1... so in any garden variety pullback, they will all trade v similarly and so I'd rather just pay less for the hedge.
- Therefore I remain with high BTC exposure (vis a vis OTC:OBTC ) at nearly 50% of my book. I think this converts to ETF in the next 90 days, giving me another 10-12% pop (as it's 88-90% discount to spot). Therefore, I can pack just a 1.4% IBIT ATM short (vis a vis puts) for nearly half this exposure. If BTC runs, as I expect, but can't predict exactly (EVEN IF THE CONVERT DOESN'T HAPPEN), I lose the 1.4% but probably pick up a solid 10...15...20% on this OBTC exposure. Seems like a good hedge.
- Same thing for BUG, ROBT, UFO... IV is just low. These are all correlation 1 baskets. They let me offset my NXT and GAMB size. That's all. I'm not calling "SHORT IT ALL" but rather, if things keep running "yes" i'll make less... but I believe my long exposure OBTC/ NXT and GAMB will outrun these ETFs. And even if they are similar in px action... I'll just make less, but it will still be positive.
- Now if the market really does puke 10-15 or 20%... I'll take these shorts and just deploy across all the work on single names I like. V likely the usual suspects are the one's I've written about and I'd size these up. King among them will be BTC.
Hope that helps. I like looking at this chart. Perhaps you have one that catches your attention too... that allows us a glimpse around what inning we're in.
The TL;DR is I think we're in inning 7 of this multi-decade run. I'd guess a true top gets put in in the coming years. But unlikely this year. And I'd be surprised if we retest the Mar/ Apr lows. Dips of the 5-10% size should be bought aggressively, not feared.
Alas who knows. I don't have a crystal ball.
V

SPY 15-Min — Weak-High Sweep in Play• Discount BOS at 603.95 → impulsive leg to 606.7 (0.886)
• Weak high tagged at 607.16 – expecting continuation to 1.382 ≈ 608.61 then 1.854 ≈ 610.92
• Invalidation if price closes below 605.45 session VWAP band
• Targets: 608.61 → 610.92
• Risk: stop 604.9 (below 0.5 Fib)
VolanX bias remains risk-on while micro structure stair-steps above the 9-EMA channel.
Educational only – not financial advice
#SPY #SMP500 #OrderFlow #Fib #VolanX #WaverVanir

Nightly $SPY / $SPX Scenarios for June 24, 2025🔮 Nightly AMEX:SPY / SP:SPX Scenarios for June 24, 2025 🔮
🌍 Market-Moving News 🌍
🇺🇸 Markets Eye Powell Testimony & Consumer Confidence
Today brings a double dose of market-moving data: the June Consumer Confidence Index and Fed Chair Jerome Powell’s testimony before Congress. These will be key indicators of household sentiment and potential shifts in Fed rate guidance
🛢️ Oil Volatility Persists on Middle East Strain
Oil prices briefly spiked after U.S. strikes on Iran’s nuclear facilities, prompting fears of supply disruptions. However, prices have since dipped as ceasefire hopes emerge. Investors remain cautious on energy headwinds
💱 Dollar Retraces on Safe-Haven Rotation
The dollar softened after peaking as geopolitical tensions eased slightly. Still, it remains sensitive to Powell’s tone and confidence data, which could reintroduce volatility
📊 Key Data Releases & Events 📊
📅 Tuesday, June 24:
10:00 AM ET – Conference Board Consumer Confidence (June)
Monitors household optimism; a rebound could support consumer spending and equities.
10:00 AM ET – Fed Chair Powell Testimony Begins
Powell appears before the House Financial Services Committee. Market focus: inflation outlook, tariffs, and potential timing for rate cuts.
⚠️ Disclaimer:
This information is for educational and informational purposes only and should not be construed as financial advice. Always consult a licensed financial advisor before making investment decisions.
📌 #trading #stockmarket #economy #Fed #trade #energy #technicalanalysis

SPY (S&P500 ETF) - Price Bouncing Up from Support after NewsSPY (S&P500 ETF) price has bounced up from the $593 support level after recent global news (de-escalation news).
Price action has slowed and consolidated in June 2025, and the S&P500 is still maintaining a price uptrend.
The 50EMA and 20EMA Golden Cross is still active and in progress (since May 2025).
The next stock market earnings season is not for another 3 months. Inflation, interest rate news, global events, government news, corporate news will continue to affect price volatility this summer.
Resistance Levels: $604, $610, $612, $619.
Support Levels: $600, $593, $586, $579.
