BNB/USDT 4H ReviewHello everyone, I invite you to review the chart of BNB in pair with USDT, also on a four-hour interval. First of all, we can use the blue lines to mark the triangle in which the price is moving, what's more, at this point we can see that the price quickly dropped from the place where we touched the blue ema cross 200 line, remaining in a downward trend.
Now let's move on to marking the support places. We will use the Fib Retracement tool to mark supports, and as you can see, we can first mark the support zone from $210 to $207, while we still have strong support at $204.
Looking the other way, we can similarly mark places where the price should encounter resistance on the way up. And here the first resistance zone starts at $215 and ends at $219, then we have the second zone from $223 to $228, and then strong resistance at $234.
The CHOP index indicates that the energy has been used and is currently slowly growing, the RSI showed an increase and now a strong recovery is visible, while the STOCH index also exceeded the upper limit, which resulted in a strong price recovery.
BNBUST.P trade ideas

BNB - BUY targets about to hit 💰📉Hi Traders, Investors and Speculators of Charts📈📉
Binance coin is oversold, but our technical indicator has not yet flashed the "Extreme Oversold". This indicates that it's possible to see one more move downward (even if it's just a wick) before the RSI corrects from being Oversold.
BNBUSDT looks like it's about to hit my spot buy targets with the traditionally approach of buying low and selling higher at the first and second resistance zone. Leverage trades often get shaken out by algorithms, spot trading could be strategically used to buy lower and sell higher; old school style.
_______________________
📢Follow us here on TradingView for daily updates and trade ideas on crypto , stocks and commodities 💎Hit like & Follow 👍
We thank you for your support !
CryptoCheck
CRYPTOCAP:BNB BINANCE:BNBUSDT

BNBUSDT Its Flag Pattern Or Falling Wedge Pattern Dear Senior , Can you please guide me , On Monthly time frame , i see this ,
What is This
Its a Flag Pattern Or Falling Wedge Pattern
Your Reply Positively Appreciated ,

BNBUSDT : Falling Wedge Pattern On WFalling Wedge Pattern On Weekly Time Frame ,
Or
Flag Pattern On 1 Month Time Frame
Pls Advised
Your Comments are appreciated

BNB/USDT 1DAY UPDATE BY CRYPTOSANDERS !!Hello, welcome to this BNB/USDT update by CRYPTO SANDERS.
CHART ANALYSIS:- BNB, formerly Binance coin, was another big mover on Tuesday, as the token rose for a back-back session.
BNB/USD reached a high of 213.19 earlier in the day, after starting the week at a low of 208.02.
the native token of cryptocurrency exchange Binance now seems to be pushing for a ceiling of 220.
BNB bulls will need to surpass an upcoming resistance point of 47.00 on the RSI indicator.
BNB is now at a reading of 44.41, with the token trading marginally lower at 211.74.
I have tried to bring the best possible outcome to this chart.
Hit the like button if you like it and share your charts in the comments section.
Thank you

BNB By HesamUNTHey traders
BNB to the 170$ !!!!
what u think ?
share ur chart and leave a comment
Additional information will be in the updates

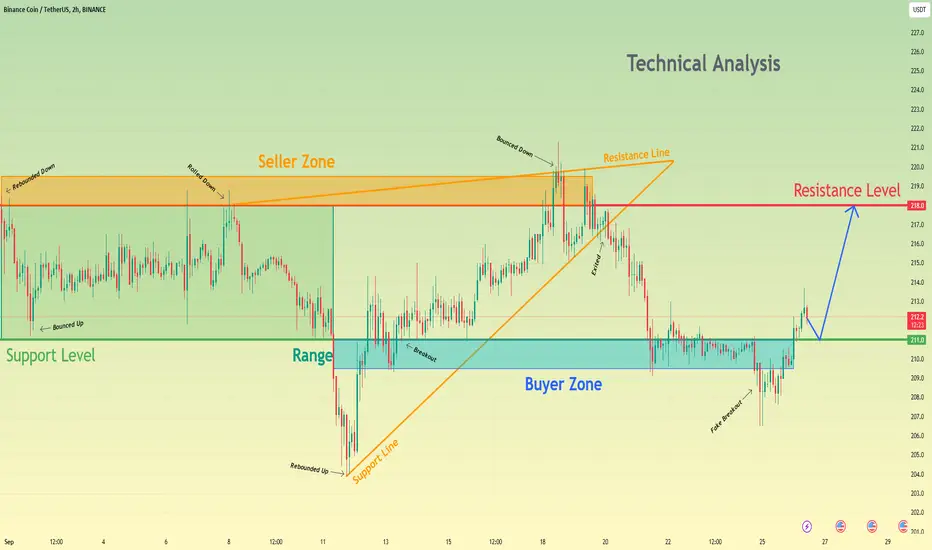
Binance Coin can make correction and then continue to move upHello traders, I want share with you my opinion about Binance Coin. By observing the chart, we can see that the price some days ago started to trade inside the range, where it rebounded down from the 218 resistance level, which coincides with the seller zone and fell to the 211 support level. Then it bounced up to the top part of the range, which coincided with the resistance line and then it rolled down back. Also, BNB broke the 211 support level and fell to the support line of the wedge, where it at once rebounded and made a strong upward impulse until to the resistance line, thereby breaking two levels - 211 and 218. But soon BNB bounced down and backed up to the support level, which coincided with the buyer zone, exiting from the wedge. Also, a not long time ago it made a fake breakout of this level and in a short time back up. Now Binance Coin trades near the support level and maybe it can make a correction to this level and then continue to move up to the resistance level. For this case, I set my target at 218 level. Please share this idea with your friends and click Boost 🚀
BNB: Bear TriangleA nearly pristine Triangle is emerging on the D1 chart. It meets the minimum requirements for completion, as indicated by a bearish signal on the H4. The pattern's standard target is 195. Note that it is part of an impulse from the 261.7 price level, which is nearing completion.

#BNBUSDT #LQR #TOBTC #LaqiraProtocolThe price is suffering in a certain channel. The price has had an unsuccessful breakout of the channel ceiling that has been bounced from the upper mid-line Level of the channel The highest Level is the seller and in the lowest Level of our Buyers after confirmation and matching with the bitcoin levels you can open a trade. This analysis is not an offer to buy or sell

BNBUSD ❕ bullish takeoverBNB broke upwards 50EMA (1H and 30m TFs)
The price formed a bullish takeover at 1H and 30m TFs.
I expect BNB to continue its upward move.

BNB/USDT Analysis:- Ready for $100 in few Days?Binance Coin (BNB) Technical Analysis: A Bullish Future Amidst Short-Term Challenges:-
Introduction:
Binance Coin ( EURONEXT:BNB ) is currently trading at $209, and there are some intriguing developments in its chart that we need to explore. This technical analysis will delve into the short-term expectations for EURONEXT:BNB and provide insights into potential buying opportunities and long-term prospects. Please note that this analysis represents my personal opinion and is not financial advice. Always conduct your own research before making any investment decisions.
Short-Term Outlook:
As we examine the current chart for $BNB/USDT, it's evident that there's a potential downside move looming in the coming days. However, there's more to the story.
In the weekly chart, a Bull flag pattern is forming. This suggests that while we may see short-term bearishness, there's a strong indication of a bullish trend in the near future. The critical support level for the Bull flag channel is at $100, and I anticipate $100 becoming a key price point in the short term.
Opportunity in the Dip:
With the strong support at $100, this presents an excellent buying opportunity for investors looking to enter the EURONEXT:BNB market or increase their holdings. It's important to note that purchasing at or near this level could yield substantial gains when the next bull run occurs.
Long-Term Perspective:
While the short-term may pose challenges, the long-term outlook for EURONEXT:BNB is quite promising. I anticipate a significant bull run in the future, with price targets ranging between $2000 and $3000. However, this is a longer-term projection and should be considered as such.
Critical Price Levels:
Currently, the $210-$250 range is of utmost importance. Traders and investors should closely monitor this level as it could serve as a pivot point for EURONEXT:BNB 's short-term direction.
In summary, Binance Coin (BNB) is experiencing short-term turbulence, but the formation of a Bull flag pattern suggests a bullish future. The $100 support level is key, and buying opportunities may arise there. Long-term prospects for EURONEXT:BNB are exciting, with potential for substantial gains in the next bull run.
Support Levels:
Short-Term: $200/$100
Resistance Levels:
$310/$460/$660
Remember, this analysis is my personal opinion, and it's crucial to conduct thorough research and consider your risk tolerance before investing in any cryptocurrency. Stay informed and make informed decisions to navigate the volatile crypto market successfully.
Please Follow me for More quality analysis.

BNB/USDT Waiting for Lower Zones to be ReacedHey traders👋
BNB coin is another one on our watchlist today where we see a nice potential for some short-term drop to happen!
We are looking for price to reach $203 zone and from there we are going to see how price will react to this zone! If everything works put this would be good zone for buy but if this zone fails to hold then we will see pretty sweet drop!
If you like ideas provided by our team you can show us your support by liking and commenting.
Yours Sincerely,
Swallow Team
Disclamer:
We are not financial advisors. The content that we share on this website are for educational purposes and are our own personal opinions.


BNB/USDT 1H Review ChartHello everyone, let's take a look at the BNB to USDT chart on a one hour time frame. As you can see, the price has fallen below the local uptrend line.
After unfolding the Fib Retracement grid, we see that the price remains just above the support zone from $210 to $207, but when we fall lower, the next support is at $203.
Looking the other way, we see that the resistance at the level of $212 rejects the price, but then we have a significant resistance zone from $216 to $218, and then the resistance at the level of $221.
Looking at the CHOP indicator, we see that there is still a lot of energy for the move, and on the RSI indicator, despite a very small increase on the chart, we see an increase on the indicator, which may result in a small price increase in the coming hours.

CZ and Binance to be testedThe market will test Binance before this winter comes to an end, unless the US authorities get to them first.
I actually believe Binance has a credible organization in an industry that is full of the opposite.
CZ will likely be viewed in 5 years or so as one of the most visionary entrepreneurs of our time.
I believe his success will anger the few nations that don't allow his operations, but the changing world order does not care about rumblings from the past.
Not having a headquarters is genius, and perhaps one of the reasons Binance will make it through the onslaught of attacks coming their way.
Do not underestimate the man in flip-flops!

BNB Binance Coin PT| Binance vs SEC Lawsuit | Whales DumpingIf you haven`t read my article about Binace being the new FTX:
The you need to know that Binance disputes the SEC's allegations of mishandling customer funds, deceiving investors, and violating securities laws.
The legal battle between Binance and the SEC has sent shockwaves through the cryptocurrency community.
Binance and its affiliates assert that the SEC is overreaching its jurisdiction on digital assets, especially without any clear legislative guidance from Congress. The original lawsuit, filed in June, accused Binance of unlawfully listing unregistered securities.
Historically, the actions of whales have been instrumental in shaping the price movements of Bitcoin and the broader cryptocurrency market.
Non-whale addresses, those holding less than 100 BTC, now account for over 41% of the total Bitcoin supply. Meanwhile, whales, entities holding between 100 and 100,000 BTC, have witnessed a decline in their collective holdings to 55.5%, marking their lowest ownership level since May.
The decrease in whale holdings could signal a potential change in the market's dynamics, potentially leading to increased volatility and uncertainty.
These developments collectively cast a shadow over the cryptocurrency market's near-term prospects.
In this context, my price target for BNB Binance Coin is $184.
Looking forward to read your opinion about it!

SEE YOU AT 150$!THE LEGEND
THE KING OF ALL CHARTS IS BACK
you wont believe it till you see it!
SIMPLICITY IS HARD
BNB is going to 150$
there I might decide to buy or not
Good luck

BNBUSD ❕ ready to riseBNB has reached a strong support level.
Trading volumes changed insignificantly.
I believe that the price will grow after overcoming the resistance level.

BNB/USDTShort-Term 1H ReviewHello everyone, I invite you to review the BNB/USDT chart. As we can see, the price has broken down from the upward trend channel, and currently we remain below the downward trend line, and what's more, when we look at the EMA Cross 200, we see that we have also fallen below the moving average, which means a return to the downward trend.
Let's start by marking support points for the price and we can see that first we have a support zone in which the price stays from $212 to $209, but if the price drops lower, the next support is at $206.4.
Looking the other way, we can similarly determine the resistance areas that the price must face. And here we see that the current rebound was reversed before it reached the first resistance zone from $213 to $215, then we have resistance at $217.8, and then a strong resistance zone from $219 to $222, where the price ended the previous move growth.
The CHOP Index indicates that most of the energy is currently being used. On the RSI, we are reflecting from the mid-range border, at which the price is declining, while on the STOCH indicator we have confirmation that when the energy reached the upper limit, the price rebounded and we are currently in the energy loading trend.

BNBUSDT - Price can make correction and then continue to growHi guys, this is my overview for BNBUSDT, feel free to check it and write your feedback in comments👊
After price bounced from $217 resistance level, it entered to falling channel, where it declined to $210 support level.
Then Binance Coin broke this level and fell to support line of wedge, in which price at once bounced back.
Inside wedge, price rose to resistance level, which coincided with resistance zone, and even broke it and reached $220 points.
But then price started to decline and in a short time backed up to support level, thereby breaking $217 level and exiting of wedge too.
Firstly BNB fell to support area, but recently it bounced up and now trades near, tha'ts why I think price can make correction to $210 again.
And then Binance Coin can continue to rise to $215 level.
If this post is useful to you, you can support me with like/boost and advice in comments❤️

BNB/USDT still waiting for that push! Hey traders 👋
BNB coin is next one on our watchlist with still good chance for a bullish movement here! But Wait for a conformational breakout from EMAs. For now...just sit back and watch closely!
If you like ideas provided by our team you can show us your support by liking and commenting.
Yours Sincerely,
Swallow Team
Disclamer:
We are not financial advisors. The content that we share on this website are for educational purposes and are our own personal opinions.

HelenP. I Binance Coin can fall little more and then rebound upHi folks today I'm prepared for you Binance Coin analytics. After the price bounced from the 217 resistance level, which coincided with the resistance zone, it first declined to the 211 support level. Next, the price broke this level and declined to the support zone, but soon BNB continued to fall and declined to the trend line. Then the price rebounded from the trend line and made impulse up to 211 support level and even rose higher of that, thereby breaking it, and then started to trade near this level. Some time ago price rebounded from the 211 support level and made impulse up again to the resistance level. After the price reached the 217 level, BNB broke it and rose to 221 points, but soon price rolled down and started to decline. Price declined below the resistance level, thereby breaking it, and also reached the trend line, which it recently broke too, and declined lower. At the moment Binance Coin trades below the trend line and I think the price can decline a little more and then bounce up to the resistance level. For this case, I set up my target at the 217 resistance level. If you like my analytics you may support me with your like/comment ❤️

BNB SHORT!BNBUSDT have been in a descending triangle since the top (Feb2021) till current time. BNBUSDT have been holding support at $200 level for more than 900 days now. It is likely that BNBUSDT is going to break support. The $200 level is a critical level for BNBUSDT if this level breaks there not much support for BNBUSDT and would likely go to the next level of support which range from $50-60. I'm currently in a shorting position for this BNBUSDT.
