BONK: Bullish Divergence at the Lows (Aggressive Counter-Trend)
BONK is currently presenting a classic "High Risk / High Reward" scenario. My institutional scanner has just flagged a Signal 4 (Bullish Divergence), but context is key.
Here is the technical breakdown of this setup:
1. The Bullish Signal (The Entry)
Liquidity Sweep: Price pushed down to take ou
Related pairs

Is BONK a good investment?Stats shows that the RSI is forming a higher low, as people begin to buy and hold til 8th of March, expecting high amount of profit returns up to +170%. However, investors are still waiting for a good signal to confirm.

$BONK/USDT QUICK ANALYSIS (1H)Let’s strip this down to what actually matters and ignore the meme noise.
BINANCE:BONKUSDT was in a clear downtrend—lower highs, lower lows, sellers in control. That’s the red zone and repeated BOS (Break of Structure) you see on the left. Then something important happened: price stopped falling,

50% and more with BONK!!!!!Recent uptrend from Jan 1-5 could replicate in the following days, making a new high up to 0.00001582 (Green Arrow) or slowly building it up for a couple of days (Yellow Arrow) like what happened in April 2025 due to same angle of trend. In long-term, investors should be looking forward to the peak

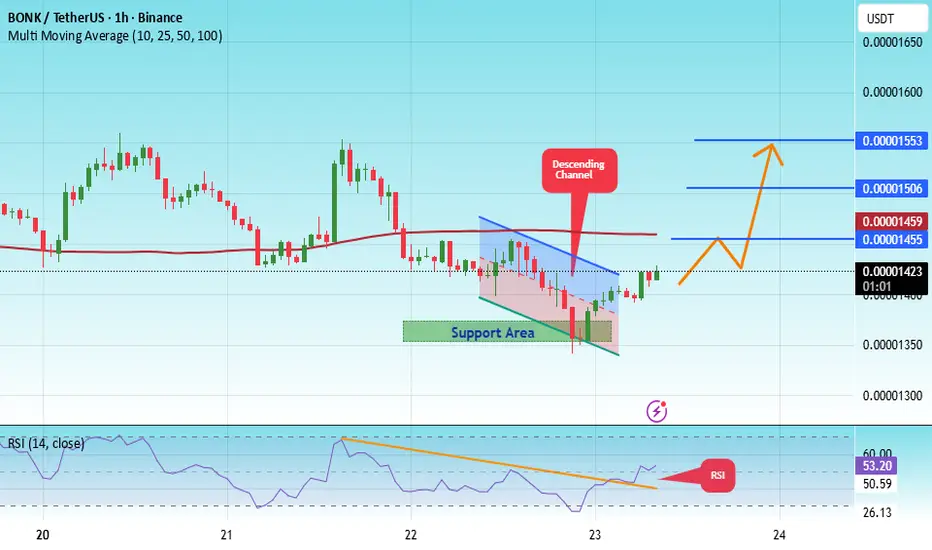
BONK to the moon 25% toward 0.00001460hi
the price breaks the descending channel to the upside and if this support areas act in positive way we can witness at least 25% gain for BINANCE:BONKUSDT toward 0.00001460$

BONK/USDT at a Breakpoint — Relief Rally or Trend Reversal?BONK/USDT is still trading within a clear primary downtrend structure that has been in place since the July–August 2025 peak. This is defined by a well-respected descending trendline (yellow line), which has acted as a dynamic resistance and rejected price multiple times.
Recently, in early January

BONK/USDT - Decision Point Strong Downside Pressure?BONK/USDT on the 4D timeframe is entering its most critical phase since mid-2025. The price is now sitting right at the major horizontal support at 0.0000097–0.0000098, while a persistent descending trendline continues to press from above, forming a clear descending triangle — a pattern that often p

BONK ( $BONK) Price Sits at a Critical Decision ZoneBONK ( CRYPTOCAP:BONK ) trades near $0.000009051, sitting directly on one of its most important historical support zones. This area triggered multiple rallies in the past, making it a major pivot that now determines whether BONK rebounds or extends its decline. Market sentiment is split, and traders

BONKUSDT Short ideaBONK USDT is bearish according to daily Bias, H1 is already showing us bearish confirmation, just take m5 confirmation and you can sell . #NOTaFinancialAdvice

#BONK/USDT — Accumulation Zone Before a Potential Major Revers#BONK
The price is moving within a descending channel on the 1-hour frame, adhering well to it, and is heading for a strong breakout and retest.
We have a bearish trend on the RSI indicator that is about to be broken and retested, which supports the upward breakout.
There is a major support area
See all ideas
Summarizing what the indicators are suggesting.
Oscillators
Neutral
SellBuy
Strong sellStrong buy
Strong sellSellNeutralBuyStrong buy
Oscillators
Neutral
SellBuy
Strong sellStrong buy
Strong sellSellNeutralBuyStrong buy
Summary
Neutral
SellBuy
Strong sellStrong buy
Strong sellSellNeutralBuyStrong buy
Summary
Neutral
SellBuy
Strong sellStrong buy
Strong sellSellNeutralBuyStrong buy
Summary
Neutral
SellBuy
Strong sellStrong buy
Strong sellSellNeutralBuyStrong buy
Moving Averages
Neutral
SellBuy
Strong sellStrong buy
Strong sellSellNeutralBuyStrong buy
Moving Averages
Neutral
SellBuy
Strong sellStrong buy
Strong sellSellNeutralBuyStrong buy
Displays a symbol's price movements over previous years to identify recurring trends.
Frequently Asked Questions
The current price of BONK / TetherUS (BONK) is 0.00000719 USDT — it has fallen −8.21% in the past 24 hours. Try placing this info into the context by checking out what coins are also gaining and losing at the moment and seeing BONK price chart.
BONK / TetherUS price has fallen by −18.36% over the last week, its month performance shows a −1.20% decrease, and as for the last year, BONK / TetherUS has decreased by −71.04%. See more dynamics on BONK price chart.
Keep track of coins' changes with our Crypto Coins Heatmap.
Keep track of coins' changes with our Crypto Coins Heatmap.
BONK / TetherUS (BONK) reached its highest price on Nov 20, 2024 — it amounted to 0.00006230 USDT. Find more insights on the BONK price chart.
See the list of crypto gainers and choose what best fits your strategy.
See the list of crypto gainers and choose what best fits your strategy.
BONK / TetherUS (BONK) reached the lowest price of 0.00000401 USDT on Oct 10, 2025. View more BONK / TetherUS dynamics on the price chart.
See the list of crypto losers to find unexpected opportunities.
See the list of crypto losers to find unexpected opportunities.
The safest choice when buying BONK is to go to a well-known crypto exchange. Some of the popular names are Binance, Coinbase, Kraken. But you'll have to find a reliable broker and create an account first. You can trade BONK right from TradingView charts — just choose a broker and connect to your account.
Crypto markets are famous for their volatility, so one should study all the available stats before adding crypto assets to their portfolio. Very often it's technical analysis that comes in handy. We prepared technical ratings for BONK / TetherUS (BONK): today its technical analysis shows the sell signal, and according to the 1 week rating BONK shows the strong sell signal. And you'd better dig deeper and study 1 month rating too — it's sell. Find inspiration in BONK / TetherUS trading ideas and keep track of what's moving crypto markets with our crypto news feed.
BONK / TetherUS (BONK) is just as reliable as any other crypto asset — this corner of the world market is highly volatile. Today, for instance, BONK / TetherUS is estimated as 1.97% volatile. The only thing it means is that you must prepare and examine all available information before making a decision. And if you're not sure about BONK / TetherUS, you can find more inspiration in our curated watchlists.
You can discuss BONK / TetherUS (BONK) with other users in our public chats, Minds or in the comments to Ideas.