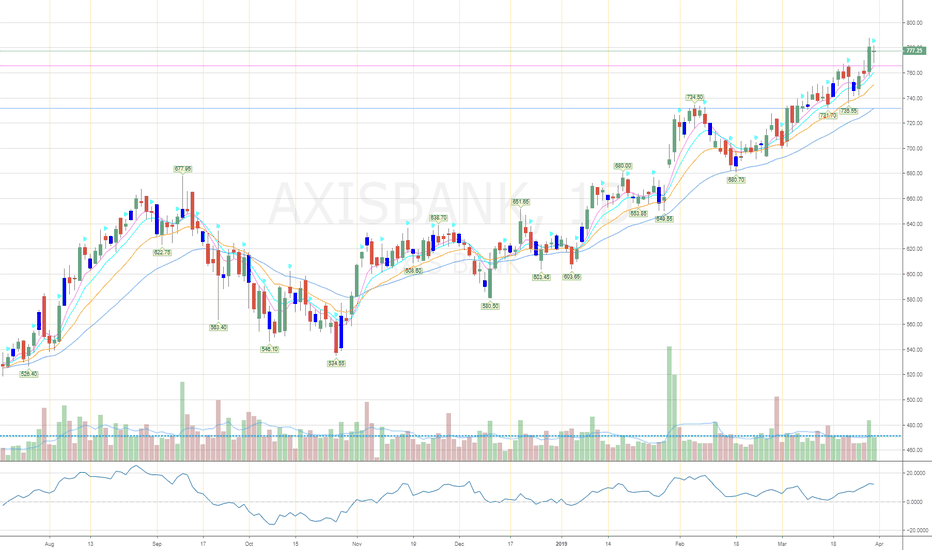
Axis Bank685-670 appears to be a Demand zone because of the Breakout Gap. One should accumulate the stock in this zone for a new high!Longby CourtroomInvestmentsUpdated 1
Axis Bank: Short Set up.Axis Bank seem to have completed a wave move on monthly charts. Wave 2 is a flat and wave 4 is a traingle. Wave 5 is an ending diagonal pattern. The upside looks near to complete. One can take short position now and add on every rise with a closing stop loss of 770. Expect a decent correction in axis bank in coming weeks and months.Educationby NileshThete1
AXIS BANK (Short)There is a bearish divergence in RSI.So if AXIS bank break 700 level then it will show 680 level.Educationby ommjitu1
Expiry strategy: Sell Axis Bank Feb 660 Pu@t Bullish trend confirmed by EMA. And recent consolidation would help the price to stay above the gap formed on 30 Jan 2019. Sell Feb 660 Put @ 1. Lot size: 1200.Longby vigneshwarajUpdated 2
Axis Bank, Breakout Target 1000+Hello Friends, Axis Bank breakout was called in the Telegram Channel (Check my signature) Posting here as well. Triangle breakout and Target is 1100. One can invest now CMP and buy on dips till 660, Target : 1100. Sl can be below the 580 levels.Longby maheswar811
Axis Bank near bearish butterfly zoneOn daily charts Axisbank forming bearish butterfly zone. Stoploss and target on graph. Seeing no big difference in forming stoploss with 2 ATR.Shortby HumbledByMarketUpdated 112
BAT formation in 15 min chartWe may get high of longer term PRZ 727 with this lower time frame bluish bat formation. target 1 / stp in graph. target 2 727. Longby HumbledByMarket223
AXIS Bank - Sell We can see AXIS bank almost reached the so called resistance level or supply zone. We could see a short term sell here.Shortby NavaneetKrUpdated 1
AXIS BANKThe most shared stock of the day. Broken out with volumes. I would wait for it to retest before thinking of taking a position though. #watchlistby rdkriplani1