BAJAJ_AUTO trade ideas


Bajaj Auto Made NEW HGHS - Breaks Out Resistance Today, it was totally a buyers show. Buyers actively took the prices above the previous resistance level of 2940 and now it shall move further up and reach to 3000-3050 levels before the profit booking takes place. It is a good time to enter with stoploss at 2870.


Baja Auto - Speeding Up (BUY)It has first made a double top at the 2680 levels and recently it has broken that resistance and made its all time high. It shows a strong positive momentum and beginning of a new bull rally. I assume a basic psychological level of 2850-2900 shall be achieved.
RSI and MACD both trending up
Target1: 2850
Stop: 2600

BAJAJAUTO resistance breakeout
Nice resistance breakout on daily chart.
1. Share is in Uptrend
2. Risk to reward is good
3. trail stops with next swing
4. Out of supply zone too.
I am not advising on investment , but this is in line with swing breakout analysis.. one MUST take investment decision according to his judgement and investment system.


BAJAJ AUTO - THE BIG SHORTIn my opinion it is the most prominent sell for this year.
Point noted on Daily Chart,
1. Prices reached at previous resistance, (looking for selling tomorrow)
2. Bearish RSI Divergence
3. Triangle Breakout pattern on weekly and Daily Chart
4. Structure trading - Lower High and Lows
Right now, it is at the lowest risk to enter this one.
Cheers

BAJAJ AUTO BREAKS FAIL I personally feel that it is a Great opportunity to short this one at current levels.
On my personal view, I believe it has broke out from a consolidated triangle pattern and has also changed the trend by making lower highs. This seems as a trend change for this one.
1. RSI Divergence
2. Triangle breakout pattern
3. Structure confirmation of lower highs
On my personal view, I feel it is a big time short.

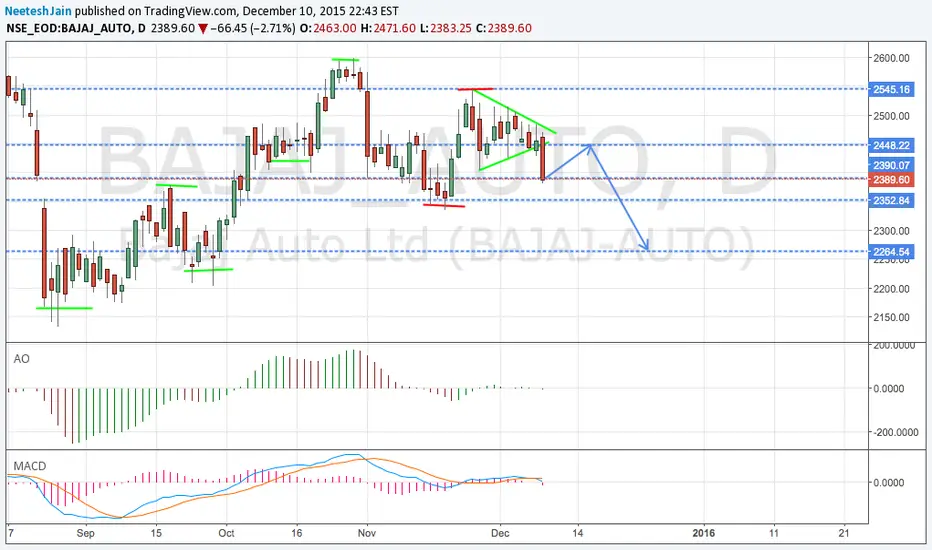
Bajaj Auto in Down Trend Currently, symmetrical triangle breakout move confirms the down trend as it has also made Lower Highs and Lower Lows (marked in red), which denotes change in trend.
MACD is also turns in negative as well as AO. - confirms downtrend too.
Therefore, due to above confirmation, I would recommend to short this one for the initial target for 2264 SL2450 and duration is 3-5 days.