BHARTIARTL trade ideas


Bullish Breakout Potential bank of baroda Hey trader
Bank of baroda stock has been consolidating within a tight down range for the past few weeks, forming a pole and flag pattern on the daily chart. As the price approaches the apex of the pattern,
volatility is likely to increase, potentially leading to a breakout.
Technical indicators, such as the Relative Strength Index (RSI) and Moving Average Convergence Divergence (MACD), are showing signs of bullish momentum building up. The RSI is trending upwards, indicating strengthening buying pressure, while the MACD histogram is moving towards the zero line, suggesting a potential bullish crossover. Also moving average 20, 50 are signal positive crossover
Furthermore, volume has been gradually decreasing during the consolidation phase, which is typical before a breakout occurs. A surge in volume accompanying the breakout could validate the bullish move and provide confirmation for traders.
A breakout above the upper trendline of the pole and flag pattern, accompanied by strong volume, could signal a buy opportunity with a target price of ₹280 will be 1st target and 2nd target 284 and a stop-loss at Below at breakout on candles as per candlesticks pattern to manage risk.
It's essential for traders to wait for confirmation of the breakout or breakdown before entering a position and to manage risk accordingly. Keep a close watch on BANK OF stock for potential trading opportunities in the coming sessions.

Bharti Airtel Ltd. (BHARTIARTL) ForecastThe chart represents the 4-hour price movement of Bharti Airtel Ltd. on the NSE. Here is an analysis and summary:
Analysis:
1. Price Trend: The price has been making higher highs, indicating an upward trend.
2. Volume: The volume is relatively low despite the price making higher highs, suggesting potential weakness in the current uptrend.
3. Divergence Pattern: There appears to be a divergence pattern, which often signals a potential reversal.
4. Support and Resistance Levels:
- Resistance: The price has recently hit resistance around 1379.
- Support Levels: Multiple support levels are indicated at 1332.50, 1266.05, and 1217.15.
5. Possible Sell Signal: The combination of higher highs with low volume and a divergence pattern suggests a possible sell signal.
Forecasted Movement:
- Short-term: The price might experience a pullback or correction from the current levels. It is projected to first drop to the support at 1332.50.
- Medium-term: If it breaks the 1332.50 level, the next target would be around 1266.05.
- Long-term: A further decline could see the price reaching the 1217.15 support level.
Summary:
The chart indicates a possible bearish outlook for Bharti Airtel Ltd. due to the combination of higher highs with low volume and the divergence pattern. Key support levels to watch are at 1332.50, 1266.05, and 1217.15. If these levels are breached, it could confirm the downtrend and result in further price declines.

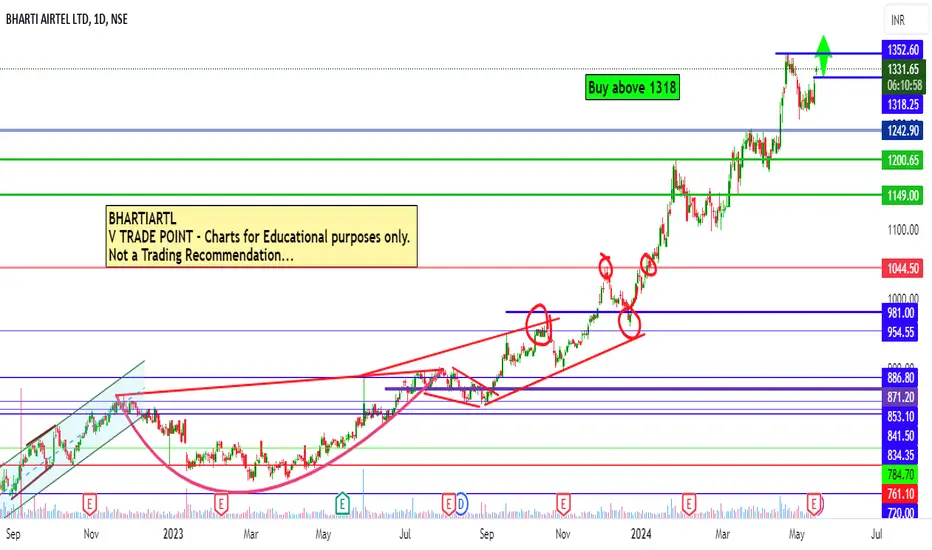
27-05-2024 - 2nd Stocks for intradayAll details are given on chart. If you like the analyses please do share it with your friends, like and follow me for more such interesting charts.
Disc - Am not a SEBI registered analyst. Please do your own analyses before taking position. Details provided on chart is only for educational purposes and not a trading recommendation

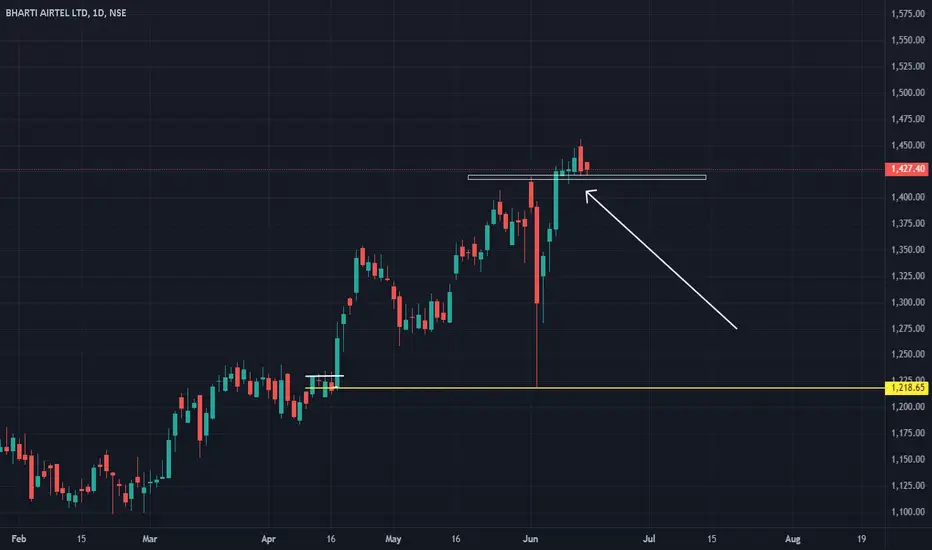
BHARTI AIRTEL LTD S/RSupport and Resistance Levels: In technical analysis, support and resistance levels are significant price levels where buying or selling interest tends to be strong. They are identified based on previous price levels where the price has shown a tendency to reverse or find support.
Support levels are represented by the green line and green shade, indicating areas where buying interest may emerge to prevent further price decline.
Resistance levels are represented by the red line and red shade, indicating areas where selling pressure may arise to prevent further price increases. Traders often consider these levels as potential buying or selling opportunities.
Breakouts: Breakouts occur when the price convincingly moves above a resistance level (red shade) or below a support level (green shade). A bullish breakout above resistance suggests the potential for further price increases, while a bearish breakout below support suggests the potential for further price declines. Traders pay attention to these breakout signals as they may indicate the start of a new trend or significant price movement.
Disclosure: I am not SEBI registered. The information provided here is for learning purposes only and should not be interpreted as financial advice. It is important to consult with a qualified financial advisor before making any investment decisions. Tweets neither advice nor endorsement.


Double Moving Averages Crossover Swing Trade📊 Script: BHARTIARTL
📊 Sector: Telecomm-Service
📊 Industry: Steel - Telecommunications - Service Provider
⏱️ C.M.P 📑💰- 1289
🟢 Target 🎯🏆 - 1368
⚠️ Stoploss ☠️🚫 - 1253
📊 Script: PATANJALI
📊 Sector: Edible Oil
📊 Industry: Solvent Extraction
⏱️ C.M.P 📑💰- 1402
🟢 Target 🎯🏆 - 1490
⚠️ Stoploss ☠️🚫 - 1352
⚠️ Important: Always maintain your Risk & Reward Ratio.
✅Like and follow to never miss a new idea!✅
Disclaimer: I am not SEBI Registered Advisor. My posts are purely for training and educational purposes.
Eat🍜 Sleep😴 TradingView📈 Repeat 🔁
Happy learning with trading. Cheers!🥂


BHARTI AIRTEL S/R for 26/3/24Support and Resistance Levels: In technical analysis, support and resistance levels are significant price levels where buying or selling interest tends to be strong. They are identified based on previous price levels where the price has shown a tendency to reverse or find support.
Support levels are represented by the green line and green shade, indicating areas where buying interest may emerge to prevent further price decline.
Resistance levels are represented by the red line and red shade, indicating areas where selling pressure may arise to prevent further price increases. Traders often consider these levels as potential buying or selling opportunities.
Breakouts: Breakouts occur when the price convincingly moves above a resistance level (red shade) or below a support level (green shade). A bullish breakout above resistance suggests the potential for further price increases, while a bearish breakout below support suggests the potential for further price declines. Traders pay attention to these breakout signals as they may indicate the start of a new trend or significant price movement.
Disclosure: I am not SEBI registered. The information provided here is for learning purposes only and should not be interpreted as financial advice. It is important to consult with a qualified financial advisor before making any investment decisions. Tweets neither advice nor endorsement.

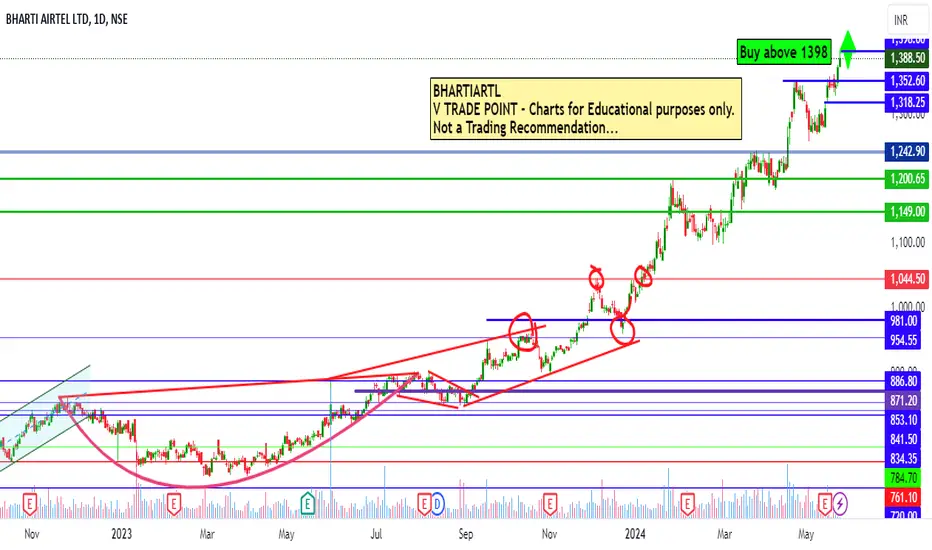
Bharti Airtel : A telecommunications pioneer8/11 - Jefferies next 5 year companies
Jefferies target by March 2029 - 2,530
Bharti Airtel has been once of the pioneers of Telecommunications in India and has been leading from the front. Recently big block deals have happened in the company and inclusion by Jefferies should help the company keep moving on the charts!


