VOLTAS trade ideas

Voltas Ltd (VOLTAS) AnalysisThe chart provided is of Voltas Ltd (VOLTAS) listed on the National Stock Exchange (NSE) of India, on a weekly timeframe. Here’s a detailed analysis and summary:
1. Trend Analysis:
- The stock was in a consolidation phase from mid-2021 to early 2023, trading in a range between approximately 1000 and 1300.
- Recently, the stock has shown strong bullish momentum, breaking out of this range and moving upwards.
2. Support and Resistance Levels:
- Support:
- Major support around 1327.60 and 1251.05.
- Resistance/Targets:
- Target 1: 1540.70 (61.8% Fibonacci retracement level)
- Target 2: 1721.55 (100% Fibonacci extension level)
- Target 3: 2012.15 (161.8% Fibonacci extension level)
3. Breakout:
- The stock has broken above the resistance level around 1327.60, indicating a potential bullish trend continuation.
- The breakout is accompanied by strong bullish candles, confirming the move.
4. Chart Patterns:
- There was a long consolidation period that formed a base, and the recent breakout suggests the beginning of a new uptrend.
- The stock appears to be forming higher highs and higher lows, a characteristic of an uptrend.
5. Fibonacci Retracement and Extension Levels:
- The chart shows Fibonacci retracement and extension levels, which provide potential target areas based on the recent price action.
- The 61.8% retracement level at 1540.70 is a key resistance level to watch.
- The 100% and 161.8% extension levels at 1721.55 and 2012.15, respectively, are further targets in case the bullish momentum continues.
6. Current Price Action:
- The current price is 1451.50, which is just above a key resistance level at 1485.85 (50% Fibonacci retracement level).
- The stock showed a strong weekly gain of 6.75%, indicating strong bullish sentiment.
Summary:
The chart of Voltas Ltd (VOLTAS) indicates a strong bullish breakout from a long consolidation phase, with the current price at 1451.50. Key support levels are at 1327.60 and 1251.05, while key resistance levels and targets are at 1540.70, 1721.55, and 2012.15. The recent breakout and strong bullish candles suggest the potential for further upside, with Fibonacci levels providing clear targets for future price action. The stock is currently showing strong bullish momentum, with higher highs and higher lows indicating an uptrend.

#VOLTAS Retested 2 years breakout zone1. The stock has recently hit a high of 1502.
2. The recent large green volume bar suggests strong buying interest.
3. The Supertrend indicator is showing a value below CMP, which indicates the trend is currently bullish as the price is well above this level.
4. The price is well above all the EMA lines, indicating a strong uptrend.
5. The RSI is above 60, which is in the overbought territory (I consider it bullish).
6. The RS line shows the stock's relative strength compared to different NIFTY indices. The stock appears to have been underperforming relative to these indices until recently, where there seems to be an upward movement indicating improving relative performance.
Overall, Voltas. appears to be in a strong uptrend.
### Disclaimer:
This analysis is for informational purposes only and should not be considered financial advice. Trading stocks involves risk, and you should perform your own research or consult with a qualified financial advisor before making any investment decisions. The author does not hold any positions in the mentioned stock at the time of this analysis.


VOLTAS SHOW THE POWER OF TATA PRODUCT Last 4 year study of that share multiple range + flag + channel breakout and breakdown 3 year drama.Now that came on FIBONACCI .5 retracement point take two down side channel ready to take reversal and revenge of investors loss. Voltas price now near by 800 TRG 920/980/1080/1200/1400 that is trg based on quarterly / half yearly and year bases target
depend upon client investment and risk capacity and holding capacity you can adjust your TRG


Share which more hot than summer....The temperature is gradually increasing, and there is a share that is even hotter than the temperature itself. I am referring to VOLTAS LTD, which has provided more than a 50% return in just the summer period. It is currently approaching the resistance level of the monthly chart.
Did you add this for another month?


Voltas something bad may is seen in the chart Voltas something bad may is seen in the chart.
As per the Kennedy Channeling Technique the Support is coming at 521.
As per Elliott Wave, Fibonacci retracement for wave 2 is expected to come around 521.
There might be some unexpected news that may impact the price pattern of Voltas Ltd.
Regards

voltasVoltas is likely to benefit from a robust demand outlook for unitary cooling products such as air conditioners, based on management commentary, Nomura analysts say in a research report. The home-appliance manufacturer seeks to grow ahead of the UCP industry, driven by higher penetration in the modern trade and e-commerce segments, new outlets and price calibration. Stable competition and operating leverage should lead to the company's EBIT margin improvement


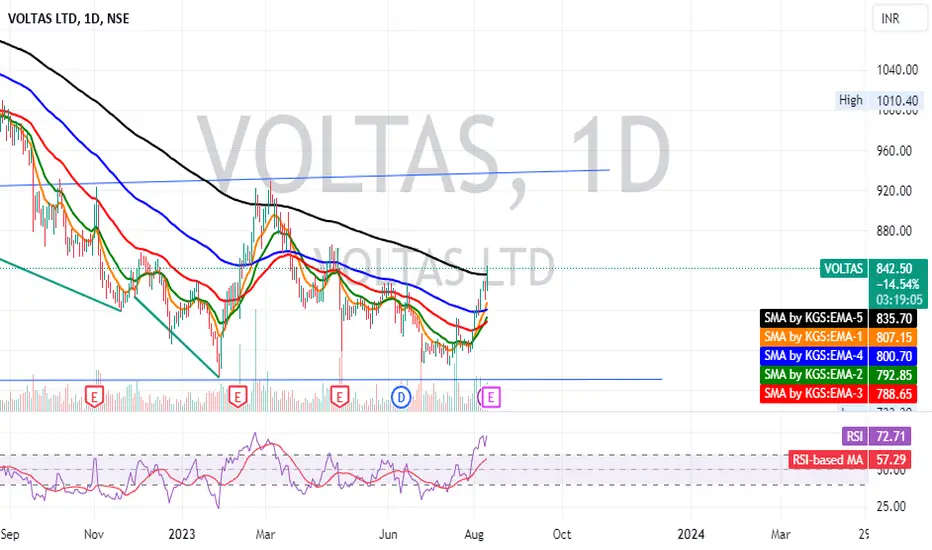
VOLTAS LOW RISK HIGH REWARDTRADE CALL low risk high reward
Voltas
cmp 843
sl 795
target 912 : 970 : 1042 : 1120
in small range of 36 points if close above 843...then target 912
big range 912 to 745 which is 167 points if break 912 then rally of 162 points
Reason of taking trade fall from 912 to 745 but now fall from 912 to 806 can be reversal sign so risk reward is good...almost 1:2 for short time frame


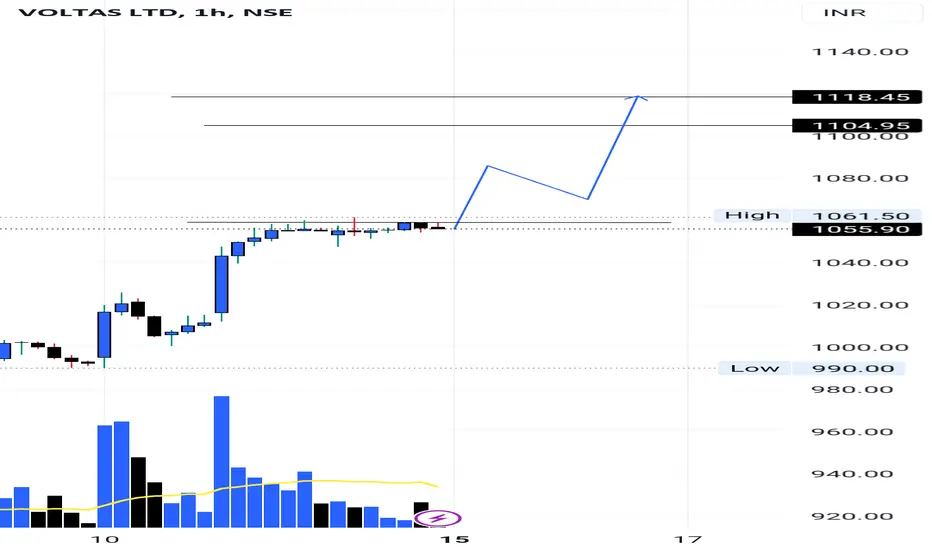
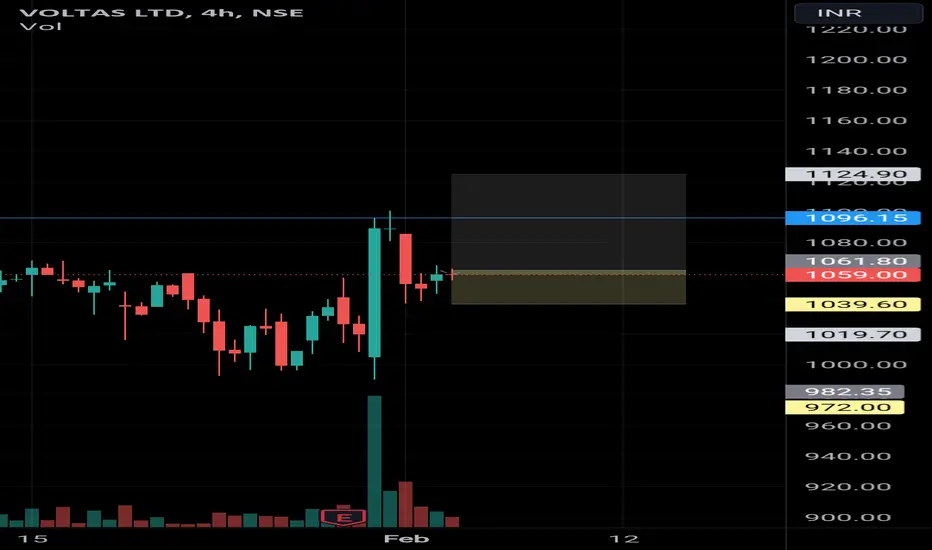
VOLTAS UPMOVE POSSIBLE Voltas might give a possible up move with a decent stoploss.
Entry above - 1060- 1062
STOPLOSS - 1040
TARGET - 1125, 1150++
NOTE- if any trade or value that's gone from the marked levels then that's not our trade wait for it to come back or just let it go
I'm not sebi registered this is my personal view

Any Pullback LOOKS BUY .It looks TRENDLINE Breakout , So basically trend has been changed Now any pullback will become Buying opportunity, Till 750-733 we can Add this in we should Place The Stops Below the recent Tested Structure and for safe side Below 700 ON DCB.(for positional)
So Ideal entry Point around 780 with Stops Below 730
for targets of
828,860,918
This will make this trade more then 2.5 RISK REWARD set up.
Please do your own Studies.
All the best.
Gratify if you appreciate the practice then you can like it, share it and
If you want me to investigate any chart for you then would cherish doing that for you.
Thank you for your time and support.
Stay safe.

Voltas, India, should target 1338 after crossing 1100Daily chart, the stock is generally in uptrend direction with some tendency for correction to 985, then will rebound to 1090. Above this 1090-1100, the target will be 1338
Technical indicators RSI and MACD are supporting the correction action
Stop loss should be considered below 965