btcusd buy tradeThe Relative Strength Index (RSI) is showing an upward trend, indicating increasing momentum. Additionally, the Moving Average Convergence Divergence (MACD) is showing a bullish crossover, further supporting the potential for an upward move.
BTCUSD.PI trade ideas

BTCUSD Do you think this position is a turning point?According to the current trend analysis, BTC has reached a critical point of long-short negotiations in the short term, but it is also at this time that we must pay attention that there is a high possibility of large fluctuations. Traders still need to observe calmly. Blindly entering the market will only put you in danger.
From the analysis, BTC can focus on the resistance of 90700 and 91500 in the short term. Focus on the support of 88500 and 87400 below.
Trading is risky, so control your position reasonably. The market is changing rapidly, and accurate signals are subject to real-time. BINANCE:BTCUSDT INDEX:BTCUSD COINBASE:BTCUSD BITSTAMP:BTCUSD

Make continuous profits of 10,000 points on BTCUSD, please come My name is Baker, and I am a professional analyst with more than ten years of experience in the financial industry. After witnessing insider trading in the market, I decided to resign from all institutional positions and form my own analyst team. At present, my team and I focus on in-depth analysis of gold, Bitcoin and oil market trends and medium- and short-term fast trading strategies. Of course, I am also a mentor to many traders in the market. Recently, I have continuously made profits of 5,000-10,000 points in BTC transactions, and my members have made profits of more than 600%. In the following time, I will share with you trading skills, accurate signals, insider information and other content. Interested traders can keep following up.
The market has been very unstable recently. If you are a novice trader or a trader with a bad mentality or a trader who has suffered too much loss in the past, it will be more difficult for you to trade in this market, because I have come from that stage. So I know it all. But how to trade is a very critical step, when to buy, when to sell, how much profit can you accept for each transaction, and how much loss can you accept for each transaction. Loss is equivalent to paying tuition fees, see how much loss you can bear and what you can learn. How to effectively control trading risks. Reasonably control trading positions. These are things that must be faced in trading. When trading, the market will create opportunities for us to make money. But it requires courage and execution. When not trading, you need patience. The market gives us opportunities to make money. But it will not give us the opportunity to continue to make money. So we have to seize the opportunity to make money.
When you come to this channel. Then your choice will not be wrong. Believe in your own vision. Because your vision will guide you how to become better. Smart people find me after losing money, become my members, and let me help them. This is indeed a method. Because in this way, you can not only get accurate trading signals, but also learn how to manage your trading mentality, how to control risks, how to trade correctly, and why to trade. BINANCE:BTCUSDT INDEX:BTCUSD BITSTAMP:BTCUSD COINBASE:BTCUSD

btc on bullish#BTCUSD price have multiple retest below 81k and more. Now we await new formation above 93k
#BTC needs to decline above 93k which holds another short bearish retest, buy between 88700 which take profit is 93k. Stop loss at 87200.
Above 91k have bullish range also.

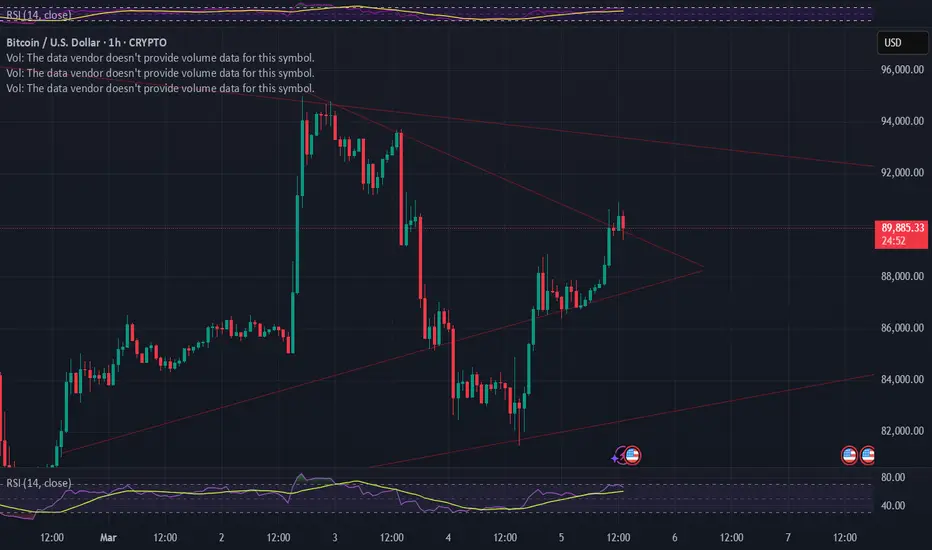
We broke up and outCrudely drawn, but we broke up and out of something here on the 1h. 93 is the resistance of the larger structure. Retesting now so this may be a good entry. RSI is cooperating nicely!
Any thoughts are greatly appreciated.
BTCUSD H4 LongRemember, successful trading relies on proper risk management and a disciplined approach. Use stop-losses to safeguard your assets and carefully plan each trade. Analysis is the key to making informed decisions. Stay updated and continue refining your strategies!

[Update BTC] (1-2-3-4-5)+(WXY) x 2This model is in line with my previous work.
I'm expecting between 77k and 110k (less probable).
This is 2017 but accelerated.
It's going twice the speed but we will see decreasing returns.
Alts-->Higher

Technical Outlook:This Bitcoin (BTC/USD) daily chart presents a well-defined rising wedge pattern, a formation often signaling a potential bearish breakdown.
Technical Outlook:
Entry Strategy: Short position upon confirmed breakdown.
Stop Loss: 77,000 USD (above key resistance).
Take Profit: 95,000 USD (first target).
Final Target: 103,000 USD (potential extended move).
A decisive break below the wedge’s lower trendline could trigger a strong downside move, aligning with the projected targets.
This setup offers a high-probability trade opportunity with well-defined risk management. What are your thoughts on this market structure?


correctionIt is expected that the upward trend will continue to form until the specified resistance levels. Then there will be a possibility of a trend change and the beginning of a downward trend.

This what my watchlist looks like!!In this video I want to show my trades and history. I do not only show you my winning trades but losing trades as well.

BTC in Support Zone Does BTC Going Upside From Here!Bitcoin (BTC) Market Update:
Caution is advised as manipulation appears to be influencing the BTC market, characterized by sudden pump and dump activity.
Key Support Level:
The current demand zone (marked on the chart) is a critical support level. If the price respects this zone, a recovery in BTC is possible.
Alternative Scenario:
Conversely, a breakdown below this level may trigger further downward momentum, leading to increased selling pressure in BTC and potential contagion to the broader cryptocurrency market.
Personal Insight:
Based on current market dynamics, a breakdown below the demand zone appears likely, potentially leading to further price deterioration in BTC.

Bitcoin (BTC/USD) - 15M Analysis & Prediction📈 Bitcoin (BTC/USD) - 15M Analysis & Prediction
🔹 Key Levels & Market Structure:
✅ 86,800 - 87,200: Support zone, potential bounce area.
✅ 88,921.45: Key level, price might test and reject.
✅ 90,924 - 91,580: Major resistance zone, strong reaction expected.
🚀 Bullish Scenario:
🔹 If price holds above 87,200, we may see a push towards 88,921.
🔹 A clean break above 88,921 could trigger a move to 90,897 - 90,924.
🔹 Strong bullish momentum above 91,580 may confirm further upside.
⚠️ Bearish Scenario:
🔹 If price breaks below 87,000, further downside towards 85,800 - 86,000 is likely.
🔹 Rejection from 90,924 - 91,580 may signal a reversal or pullback.
💡 Trading Plan:
✅ Look for bullish confirmations at major support zones for long entries.
✅ If price faces rejection at resistance, consider short opportunities.
✅ Watch price action closely around 88,921 for liquidity grabs.
#fxforever #BTCUSD #SmartMoney #PriceAction #CryptoTrading #BitcoinAnalysis #LiquidityHunt

BTC daily analysisAfter Trump's crypto reserves news, BTC was able to shrug off the bearish momentum and bounce back from around 81,500 and close above the previous daily closing of 86,000. That opens the way for price to now retest the previous daily high of 93,800. The asian session has closed slightly bearish but the daily momentum is still to the upside, which should see the London and/or New York session moving the price up. The best entry would be as the price breaks and closes above the Asian 4H high of 89,000.

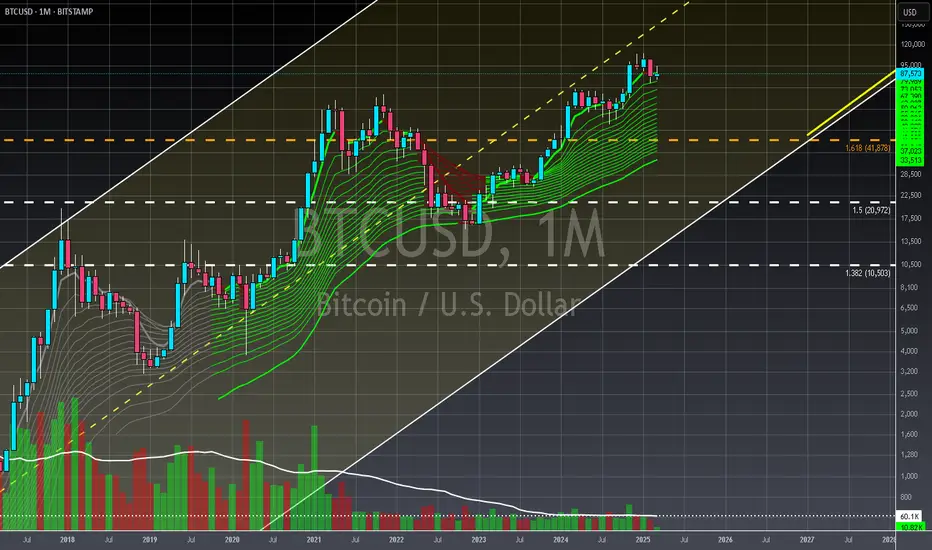
BTC - Monthly - Where Are We Heading?Click Here🖱️ and scroll down👇 for the technicals, and more behind this analysis!!!
________________________________________________________
________________________________________________________
..........✋NFA👍..........
📈Technical/Fundamental/Target Standpoint⬅️
1.) Tariff Concerns Weigh on Risk Assets: Recent tariff announcements are negatively impacting risk asset sentiment. While potentially a short-term tactical maneuver by the U.S. to demonstrate its leverage, the uncertainty creates market unease.
2.) Bitcoin's Consolidation and Potential Rebound: Bitcoin has been range-bound since early 2025, and a minor correction was anticipated. Barring a significant downturn, current levels don't present compelling buying opportunities. Historical patterns suggest a potential return to $60,000, aligning with previous major corrections.
3.) No Evidence of Significant Accumulation: Current market analysis indicates a lack of substantial hidden accumulation.
==============================
...🎉🎉🎉Before You Go🎉🎉🎉…
==============================
Leave a like👍 and/or comment💬.
We appreciate and value everyone's feedback!
- RoninAITrader
Pending BTC OrderPending BTC Order at 87,000 USD for continued buys.
Daily closed bullish, previous 4HR closed bearish but above the new range.
Assuming this is not a fakeout, it should not break the SL.


Bitcoin - A Simple ChartHello Everyone. This 1D Chart of BTC is looking Bearish to me. I think the technical damage has already been done to BTC because lately the price action is almost all influenced by American hype and spin, ranging from tariffs to fear of recession or stagflation looming around the corner. The major indices SPX, DJI, NDQ are all starting to roll over and correcting from all time highs. There are so many global Bearish indicators out there and I don't have time to write them all. You may not notice the Bearishness yet, but I feel it is here to stay for medium term. Don't get me wrong, there will be Bullish rebounds and retraces along the way (institutional and whale pump and dumps) as we are seeing today. I am for sure not going to make any public price predictions on any price targets. This is only how I see things at the moment. Personally, I will start to slowly DCA at the first Support Level of $68,000 - $74,000. My orders are already placed because this can happen very quickly with BTC and crypto in general, as we all know. The next stop if the aforementioned Support Zone breaks and confirms on the Daily chart, may be $48,000 - $52,000. My Buy Zone is in purple rectangle box. Maybe a stronger Altcoin Season will arrive soon as BTC tries to find a lower solid base. I am only publishing this for a new, simpler way of looking at BTC and the trend levels and lines to help assist the retail investors who usually get played by the big institutions. I welcome any and all comments and arguments. As always, DYOR, ask questions, do not get emotional, and be patient! Thank you for reading, best of luck, and happy trading to all of you.

BTC Brings SpringI thought that BTC would first try the 100-102k region with its movement starting from here and then make a new ATH. The bottom formation is complete and will react on a nice support with many positive divergences.

BTC Forecast until March 11, 2025 for intraday tradingFirst complete the head-and-shoulders pattern and then trade within the 72-90 corridor

BTC- bearish divergenceBearish divergence on weekly = more downward movement expected. Trade with care.

The pullback target for Bitcoin is between 55000 to 59000.Luckily, my last prediction of a double top was successful, and the pullback is halfway through.The pullback target for Bitcoin is between 50000 to 59000.
