What does this graph mean??? BtcIv noticed that the is 2 curve patterns being formed on btc creating a eye shape
What does it mean ?
BTCUSDT trade ideas

BTC Price Prediction and Elliott Wave AnalysisHello friends,
Thank you for joining me in my analysis. Remember to like, subscribe, and stay tuned for more updates. See you soon!
Thanks, Bros

$BTC extremely bullish setup on weekly! Possible 40%Hello Traders,
Btc's weekly chart pointing out really really bullish setup. However most of the traders stuck in short time frames again. Price action using EMA20 as bouncing points and correcting rsi levels slowly. Volume is clearly going down as we correcting. Also pointing out trend change towards bullish! Textbook style correction! As you can see as long as Ema 20 holds, we should see $80k ranges around or before aug-sep.

Btc Weekly chart analysis
Btc Weekly chart analysis
we tested supported level 60,000/- now we have very high liquidity at 71000 soon we will back to 70k first immediate target is 64k
cheers and follow far more ideas

Bitcoin@Bitcoin is in bottom side of Range pattern and also we lost CPR at 58745 ( Close to Moving average)But we are lucky because still not closed momentum candle on below bottom Range
so my Idea is if BTC 3 days can keep this range support we can get confirmation correction is over otherwise Firstly we will see 57k and finally 52 K
Have safe trade

#BTCUSDT #1D (Binance Futures) Descending channel break & retestBitcoin is pulling back to 50MA daily support after forming a big bull flag, a bounce towards new ATH seems likely next.
⚡️⚡️ #BTC/USDT ⚡️⚡️
Exchanges: Binance Futures
Signal Type: Regular (Long)
Leverage: Isolated (10.0X)
Amount: 5.4%
Current Price:
66989.1
Entry Targets:
1) 66666.6
Take-Profit Targets:
1) 75891.7
Stop Targets:
1) 62969.2
Published By: @Zblaba
CRYPTOCAP:BTC BINANCE:BTCUSDT.P #Bitcoin #PoW bitcoin.org
Risk/Reward= 1:2.5
Expected Profit= +138.4%
Possible Loss= -55.5%
Estimated Gaintime= 1 month

BTC Price Prediction and Elliott Wave AnalysisHello friends,
Thank you for joining me in my analysis. Remember to like, subscribe, and stay tuned for more updates. See you soon!
Thanks, Bros

BTCUSDT#Bitcoin Chart Update: One of the top indicators, the TD Sequential, has given a buy signal on the 4-hour #BTCUSDT chart. As you can see on the chart, it has given four buy signals in the past three months, each followed by significant gains. The target is a 22% increase, aiming for the 70k level.

EARLY BIRD BITCOIN SHORT ENTRYTrade Position and Rationale:
I am currently holding a short position (entrey at $68,600) based on the rejection at the $70,000 resistance level. This level has proven to be a formidable barrier, suggesting strong selling pressure. The additional indicators reinforce this bearish sentiment.
Key Levels to Watch:
Primarly, as the VRVP shows, we are having the early bird rejection candly from the volume profile POC. If the trend reverses with a rejection here I would not expect anything less than...
Immediate Support Level (White Line):
$60,883.0: This is the immediate support level, marked by the white dotted line. A strong reaction at this level is crucial. A bounce here could indicate a potential double bottom, which might signal a reversal. However, a break below this level would confirm the bearish trend and open up lower targets.
Potential Targets if Support Breaks (Red Dashed Lines):
First Target: $51,740.5: This level aligns with a high-volume node on the volume profile and represents a significant previous support level. The confluence of these factors makes it a strong target if the $60,883.0 support breaks. Consolidation or a temporary halt in the decline is likely around this area.
Second Target: $42,862.2: This major support level from historical price action is reinforced by another high-volume node. Reaching this level could present a substantial buying opportunity for long-term investors, as it is closer to previous accumulation zones.
Volume Profile Analysis:
The volume profile shows the distribution of trading activity at various price levels. The prominent high-volume nodes at $51,740.5 and $42,862.2 suggest these levels are critical points of interest. These nodes often act as strong support and resistance areas due to the significant trading activity and liquidity they represent.
RSI Analysis:
The Relative Strength Index (RSI) is currently at 44.08, below the neutral 50 level, indicating bearish momentum. The RSI has been trending downwards, reflecting increasing selling pressure. Watch for the RSI approaching the 30 level, which could indicate an oversold condition and potential for a short-term bounce.
MACD Analysis:
The MACD is currently showing bearish signals, with the MACD line (blue) below the signal line (orange) and both lines trending downwards. The histogram is also in negative territory, indicating increasing bearish momentum. This reinforces the short position and suggests that further downside is likely.
Additional Insights:
Bearish Divergence: The RSI and MACD both show bearish divergence, supporting the expectation of further declines. This divergence adds confidence to the short position.
Risk Management: For those in short positions, setting a stop-loss slightly above the $68,000 resistance level is prudent. This strategy limits potential losses if the market unexpectedly reverses. Similarly, long-term investors looking to buy should consider setting buy orders around the $51,740.5 and $42,862.2 levels with appropriate stop-losses to manage risk.
Market Sentiment Indicators: The bearish sentiment in the RSI and MACD, combined with the price action and volume profile, suggests that market participants are currently more inclined to sell than buy. This could lead to further declines in the near term.
Conclusion:
In summary, Bitcoin's price action and additional indicators suggest a bearish trend with potential for further declines. The immediate support level to watch is $60,883.0. If this level breaks, the next targets are $51,740.5 and $42,862.2. The volume profile, RSI, and MACD analysis support these levels as significant areas of interest. Traders should be prepared for volatility and manage their positions accordingly.
Stay vigilant, use proper risk management, and adapt to market changes. Happy trading!

BTCUSDT - Probable Inverse Head & Shoulders with BUILD UP?!Hey guys!
Market's been really challenging lately, specially for those into Futures Trading that's why I'm going to repeat again. I strongly recommend you SPOT trade instead. So, as for BTC goes, the liquidity absorption is real and to either side!
Where to buy?
1) One would be the rising green zone I've marked but this would mean a drop to about 56k or 52k which is pretty heavy. Still is my favorite scenario.
2) I suspect BTC is creating a pattern right now, just right after the uptrend which could be an inverse head & shoulders one. This pattern forming after an uptrend is pretty strong and bullish. However, we still need to see a proper breakout of the neckline otherwise this idea gets destroyed. So I'd buy the re-test of the breakout if it ever happens.
TARGETS
1) Let it run and there are several ways to take profits partially but I'd suggest as long as the uptrend doesn't break, just hold it and take partial profits at massive supply zones. Otherwise, don't touch it.
This idea is to spot for the long term. This asset is still in balanced mode, there hasn't been a breakout of the range yet. However, it's worth to note it's still a good moment to analyze what could happen to be prepared and take action accordingly.
Hope you find it useful!
Kina Tip of the Day: Remember BTC is the father of Crypto, the rest are just babies that follow big daddy so, don't marry any coin at all except for BTC. That's it.
Keep it shiny ⭐
Kina, The Girly Trader


Bitcoin - Running flat Elliot ?I expect the price to continue its upward trajectory shortly. There are indications of a developing running flat pattern.

BTC AROUND A MASSIVE ZONE Hello Traders and everyone, I am Hadi Karaali, Known as SNIPERS_FX
If you like the idea, do not forget to support with a like and follow.
BTC AROUND A MASSIVE ZONE. 📚
👉As we can see price is still overall bullish from a long-term perspective, trading inside this orange rising broadening wedge pattern.
👉Meanwhile, we are still expecting new bullish impulsive movement around our rising trendline, lining up with a strong support zone 58k-60k.
👉Moreover, and as per my trading style, I will be zooming into lower time frame, to monitor any bullish reversal pattern to confirm the next bullish movement, Unless price managed to break below the rising trendline and our massive support zone, then expect a movement lower and lower. 📚
If you like this kind of analysis don't forget to like and follow
and as usual follow your trading plan and manage your risk.
Be patient and good luck!

Bitcoin Long termERrr. I'm just playing around with the times of things and kind of just bias to this swinging like a monkey in cycles.

BTCUSDT LONG#BTCUSDT touched the Fibonacci level of 0.618, which is a common level for price correction after a peak. It seems likely to start another upward wave from here.

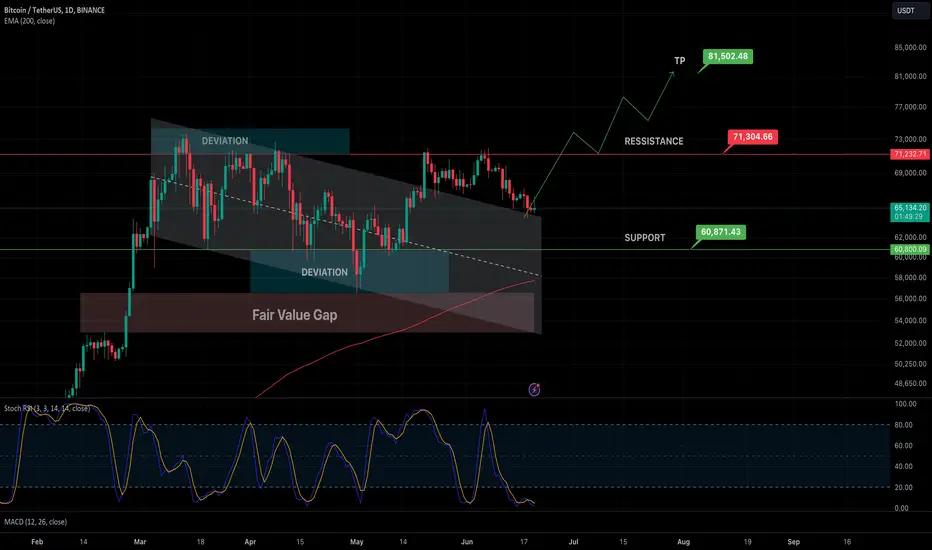
Chart Idea - BTC Swing Long for 6-8 weeksBTC looking bullish for next few weeks. It can certainly go and test $62k to $60k region. However, as per my TA, it's already hit the local bottom and need good bounce from here. Taking a swing long for next few weeks from FWB:65K on the basis of following confirmations.
Confirmations on Daily TF:
- Bull Flag Breakout and Retest
- 0.5 Fib Level Retracement at $64200 region
- Stoch RSI oversold at around 1 region
Trade Setup:
Entry: $65000
TP: $81500
SL: $59999
BTCUSDTSym triangle and its target.I had to show What I saw and I want to share my point of view with you all.Taking my analysis as a conformation or using to as a direct guide for trade.it's up to you.I hope this will be invalided.Otherwise alts will be crushed!!!

BTC LONG TRADE SETUPAnything under 60k BTC is a buy for me.
I don't think we are don't yet. I see so many bearish posts and people getting scared.
I can see one more parabolic move-up before we get a real correction.
Risking 5% of portfolio.
My SL if we get a daily close below 54k.

Quick BTC Trade to make 30%Super fine print here. The opportunity is now so forever hold your peace if you see this in 3 hours ;-)

BTCUSDT DOUBLE THREE Possible wave 4 continuation as a double 3 and the last wave down as 5-3-5 .Purple waves are considered as a path and should not be used for targets . Wave Y should not pass 161.8% of wave W or else invalid and other invalid levels are on chart .
This scenario still possible until wave B high is broken . please see my previous charts for other possible scenarios .
Good LUck

BTC / USDT Buy side idea. Bitcoin at excellent buying price of 60k, we should buy BTC at current price with target of 72k in mind within next couple of weeks, which will be 12k move from current price.
Stoploss at 57k

BTC to 53k?As we know BINANCE:BTCUSDT couldn't break old High which is at 73750, now trading at 61k. I was focusing at 61k-63k range to look LONG-FUTURES trade but looks like BINANCE:BTCUSDT is shifted other way and much possible to check 53k area. There is a valid Order Block zone between 57k-59.5k. But as I mentioned earlier BINANCE:BTCUSDT more likely to hit 53k in coming days. Don't worry even BINANCE:BTCUSDT hit 53k we are still in bull market!
I will consider LONG-FUTURES trade around 53k. Will do update on entry and take profits!

$BTC - Support and resistanceCRYPTOCAP:BTC - The support and resistance play. This play is most likely. The range should break out to be bullish here!
